Stock Market Bluff Detector
News
|
Posted 01/06/2023
|
10905
One of the most persistent themes in economic news that we have noticed is the dichotomy in market predictions. A headline about a coming bull market can be right next to another about the same market crashing. One can look to multiple headlines and lagging technical indicators and then end up even more confused than before.
There’s a saying when it comes to investigating a mystery: “Follow the money.” And in the two charts below, we will show you how we do this literally by comparing stock market movements to currency pair movements.
The Australian Dollar
AUD/USD (the value of the Australian Dollar in US Dollars) can be a great metric for the health of the global economy. A good reason for this is that Australia supplies a very significant amount of natural resources to countries, such as China, who then use the resources to make goods for the rest of the world. Our iron ore ends up in the world’s steel and our coal fires the powerplants that allow industrial production to take place. If a Chinese steel producer is anticipating more orders, they may place a large order for iron ore. And what will they need if they want to buy it? Australian Dollars. This ties our Australian Dollar to the global demand of goods.
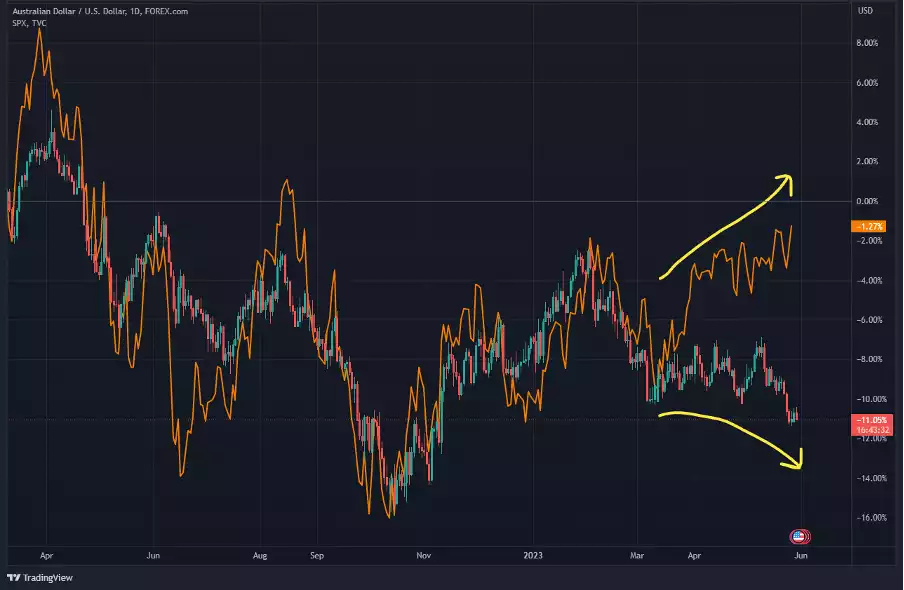
Let’s compare the Australian Dollar to the S&P500. AUD/USD is on the chart below (green & red), and the S&P500 is over the top of it (in orange). You can see they move almost exactly the same, but recently the S&P has been rising sharply and the Australian dollar has had a sharp fall. That’s quite interesting, as it may indicate that global economic health has been lowering, but money has still been piling into the stock market.

Image link - https://www.tradingview.com/x/4JTjbOKj/
The US Dollar Index
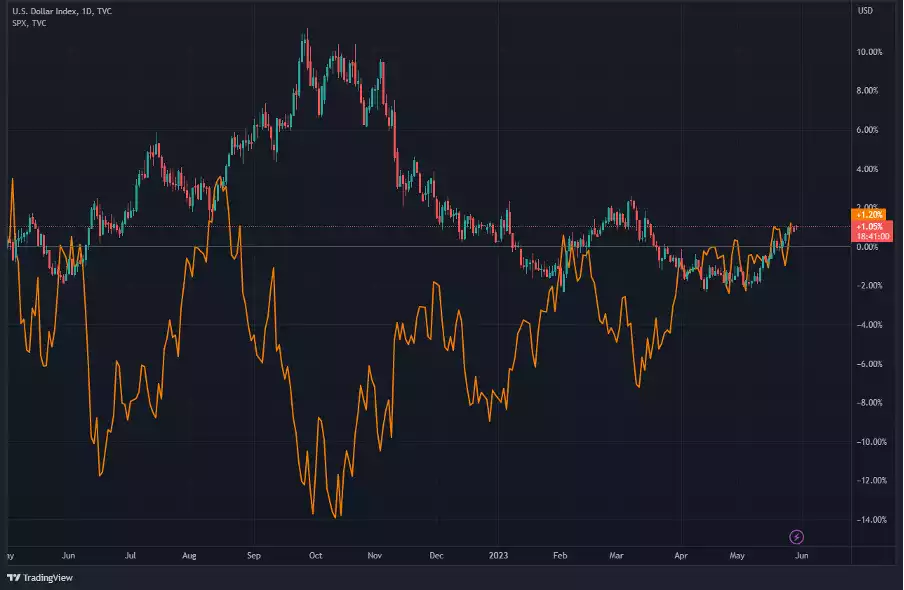
Next, one can compare the US Dollar Index (green & red) to the S&P500 (orange) visible on the chart below. The US Dollar Index is a measure of strength between the USD and 6 other currencies. As you can see on the chart below, the value of the US Dollar Index tends to move opposite to the stock market. A simple reason for this is that when the dollar is being inflated in supply, it is easier to allocate more dollars to investments in the stock market, meanwhile the value of the dollar is being diluted. The opposite can happen if the supply of dollars tends to dry up. This can lead to investors pulling money out of the stock market in the form of USD, thus also creating extra demand for the dollar as an exit ramp.
What you see on the chart below mostly lines up with the concepts mentioned: When USD spikes up, S&P500 dips down. But, paying attention to the chart in the recent 2 months, it appears that the S&P500 has been more tightly bound to the US Dollar Index price. Does this mean that they are overdue for a push in opposite directions? Perhaps the stock market investors are correct and the currencies will soon retrace, or perhaps the currencies are reflecting the rise in interest rates and ripple effects of economic pain while a large bull trap is being setup on the stock market.

Image link - https://www.tradingview.com/x/2mRXRfz1/
Behind the Scenes
Two recent events could help weigh the scales on this issue. One is that Cathie Wood and others have already mentioned nearly a month ago that the Fed has gone too far and something in the economy may break.

Another is that economists at Citi and Macquarie expect the Federal Reserve to increase interest rates again. With AUD/USD dropping, the US Dollar exit ramp rising, and more potential hikes on the horizon, can we say that the S&P500 run up is a potentially bull trap?
Gold’s Movements
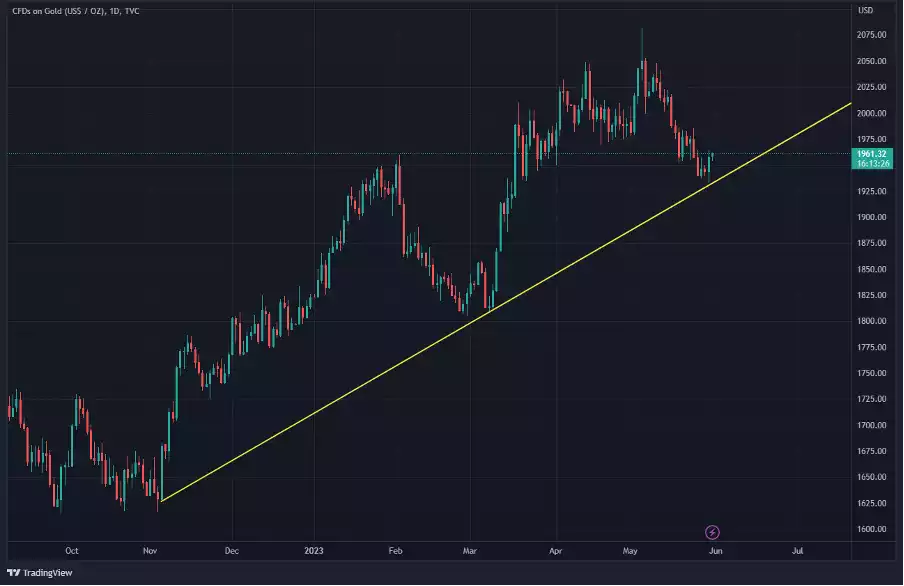
Looking to Gold/USD there has been a clear rising trend since late last year. It has just dipped again and bounced off of the trend line below (yellow), trading at a large discount compared to several weeks ago. Either further inflation of the USD, or something “breaking” in the economy could help boost gold further. The Non-farm Payroll data release this Friday at 11:30PM Sydney time may be the catalyst for its next big move.

https://www.tradingview.com/x/NCnWsKm9/