Silver’s High Was Different
News
|
Posted 22/10/2024
|
2623
In the world of bullion trading, it's easy to become immersed in the day-to-day activities of helping clients buy and sell precious metals. Despite closely following market movements, the significant price performance of silver in 2024 may still take some by surprise. In recent discussions with clients about the differences between gold and silver, it’s not uncommon to lean towards the idea that gold had shown greater movement earlier in the year. However, upon closer inspection, silver has actually outperformed gold by a few percentage points, something that can easily be overlooked due to biases surrounding price perception.
A multi-thousand-dollar price per ounce for gold increasing in value can be inherently more captivating and impressive than an AU$40-50 per ounce silver price moving positively. While it’s certainly been an impressive run for gold over the past two years, there comes a point where some people believe it’s too expensive. Although this perspective is debatable, there is a growing sentiment that lower-priced items, like silver, seem more accessible and have a greater potential for further gains. This unit bias can drive investor behaviour, making silver an appealing alternative for those looking to capitalise on its potential in the short to medium term.
This time was different
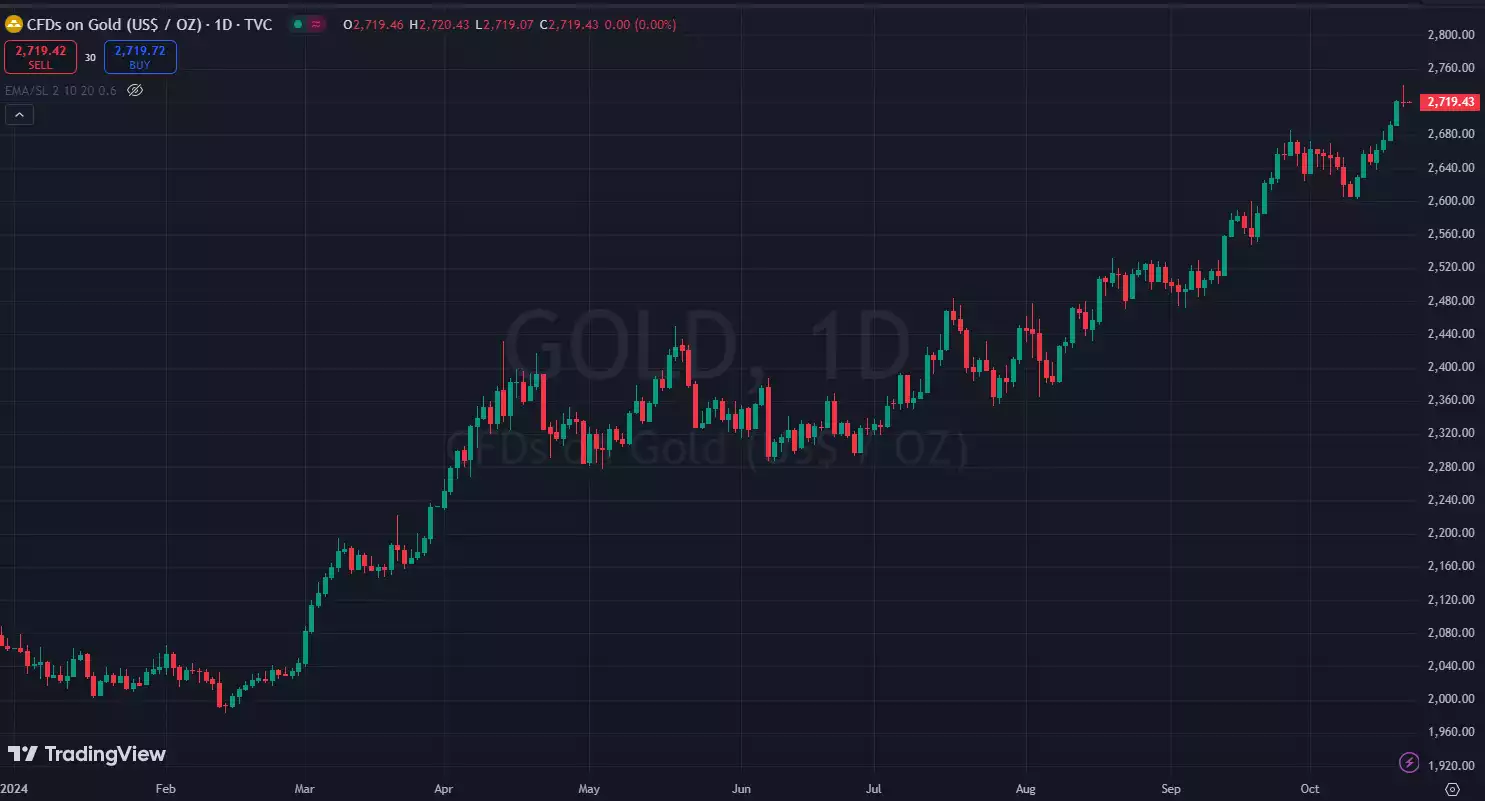
This year, the price of gold has hit an all-time high in U.S. dollars a total of 34 times. To the eye, the price performance has been ultra-strong.

Up until silver’s rampaging 6% daily gain on Friday, and despite its strong gains overall in 2024, the chart hasn’t looked so pretty because it wasn’t making new highs. Friday was significant in that not only did gold make a new high, but silver hit an 11-year high against the U.S. dollar. It feels like a new era is upon us.

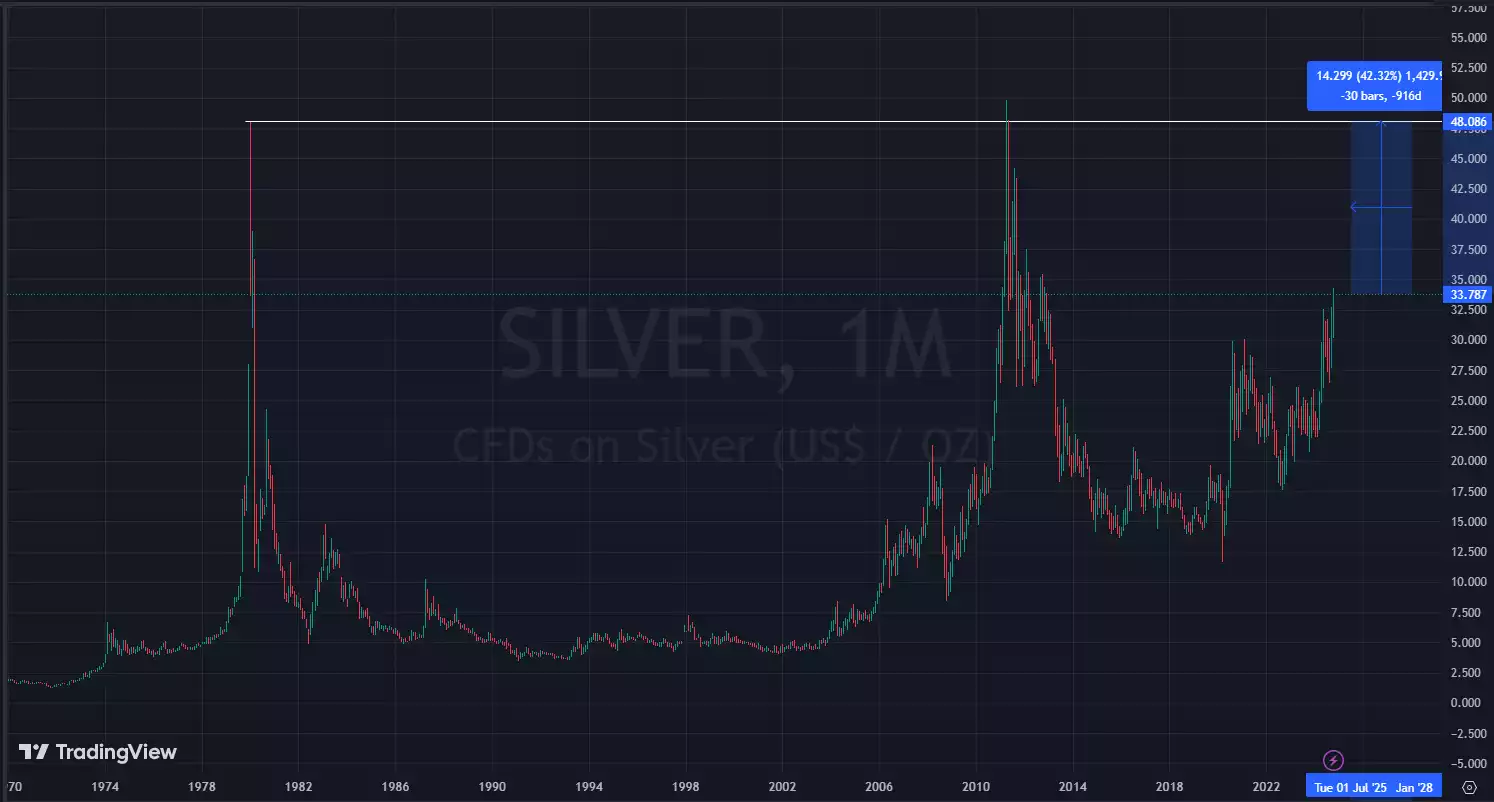
As we zoom out on the Silver/USD chart, we can see that there’s a key price level ahead at around US$48 which was last reached in June 2011 and before that, in January 1980. 1980! Germany was split in two, fax machines weren’t yet mainstream, the Australian cricket team weren’t very good, and hair was very, very large. This could be the mother of all long-term breakout setups that we need to keep an eye on.
The gold-to-silver ratio will become more and more of a focus as the tide shifts between the relative dominance of the two metals. As we discussed in last week’s article, this may be an excellent opportunity for investors to exploit a once-in-100-year trade.
Despite the macroeconomic and geopolitical environment remaining very favourable for precious metals investors, prices will need to take a breather at some point as profits are taken and price consolidates. This will be a great time to stack more metals and having some cash available could be very rewarding.