Silver Technical Analysis
News
|
Posted 07/09/2026
|
1338
Key Takeaways
- Silver has broken out on the weekly chart and held the breakout after strong US jobs data.
- Daily charts are more mixed, with silver still sitting under its 200 day moving average.
- Gold's direction remains the key thing to watch, since silver typically follows it.
What the jobs data did to rate expectations
The much anticipated NFP results came with stronger than expected numbers. US non-farm payrolls rose by 162,000 in August, well above consensus expectations of roughly 55,000, while the unemployment rate held at 4.1% (BLS via Yahoo Finance). This resulted in a perceived increase in chances of a rate hike, with rate futures moving to about a 62% probability of an increase at the 15 to 16 September FOMC meeting, up from roughly 55% before the report (Reuters via CryptoDaily).
Trump reacted to the numbers by calling for the opposite: lower rates, arguing on Truth Social that a stronger US credit position justifies cheaper borrowing (Newsmax, 4 September 2026). Goldman Sachs landed in the middle of these calls by stating that ultimately it won't be jobs numbers deciding, but inflation data. Goldman reads the August report as consistent with a solid but not overheating labour market, and expects a benign CPI print to be enough for the Fed to hold (Goldman Sachs commentary).
Silver on the weekly chart
Overall, silver has broken out on the weekly chart, which is considered bullish:
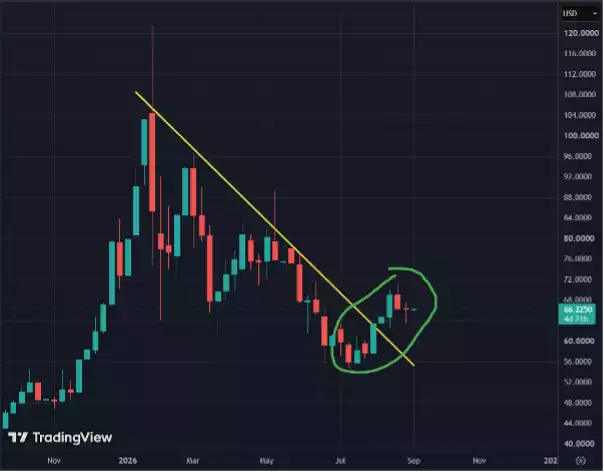
The positive US payroll data has not managed to knock the price back down thus far. Silver was A$91.83 per ounce on 5 September 2026, roughly A$1 below where it sat a week earlier (goldpricez AUD series).
Silver on the daily chart
Looking closer in at the daily chart, silver seems to be currently stuck under the 200 day moving average. Despite this, shorter timeframes have already flipped back to green:
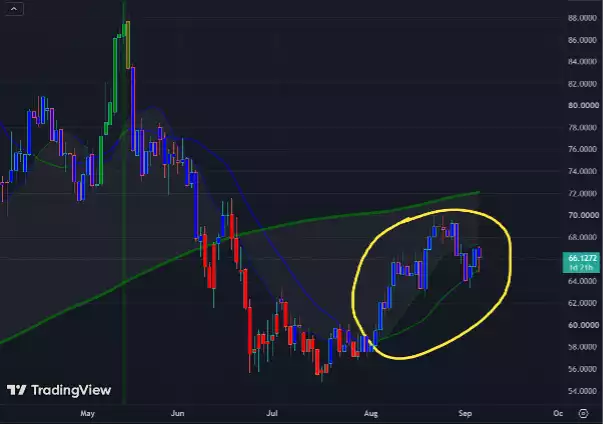
On the daily candles, however, ROC and Bull/Bear Power indicators show weakness. This makes daily candle analysis more of a mixed bag. On weekly, moving averages and popular indicators skew heavily bullish.
Why gold still sets the tone
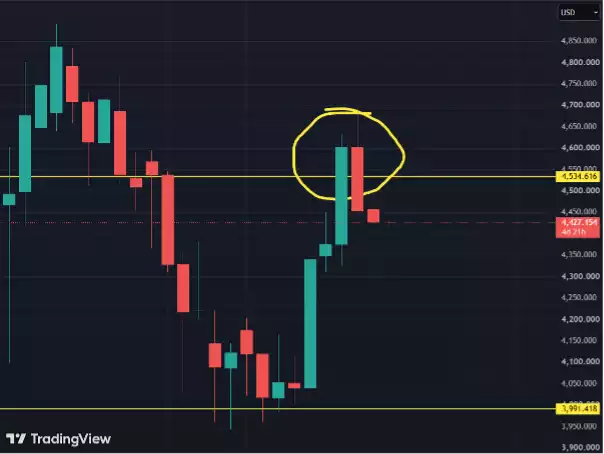
When looking at silver, gold is something that needs to be watched as well. Gold has been trading below its 200 day moving average near US$4,533 after a correction from the August highs, and had recovered to about US$4,430 by 4 September 2026 (Gold Daily Insights). Citi recently stated that gold's dip should be seen as a buy opportunity, setting a 0 to 3 month target of US$4,800 per ounce against a spot price near US$4,500 (Investing.com, 4 September 2026). Those are forecasts, not outcomes. Rising gold is typically also beneficial to silver:
For Australian buyers, the weekly picture and the daily picture are telling slightly different stories, which is often what a consolidation looks like before the next leg. Ainslie Bullion's silver bullion range covers the standard bars and coins most Australian investors accumulate through periods like this.
This article is general information only and does not constitute financial advice. Past performance is not indicative of future results. Always conduct your own research or consult a licensed financial adviser before making investment decisions.