Silver Poised to Surge – And so too Ethereum
News
|
Posted 19/11/2020
|
9308
Today we talk to the epic setup for the silver market and at the end compare that to its ‘crypto cousin’ Ethereum which too looks poised for great things.
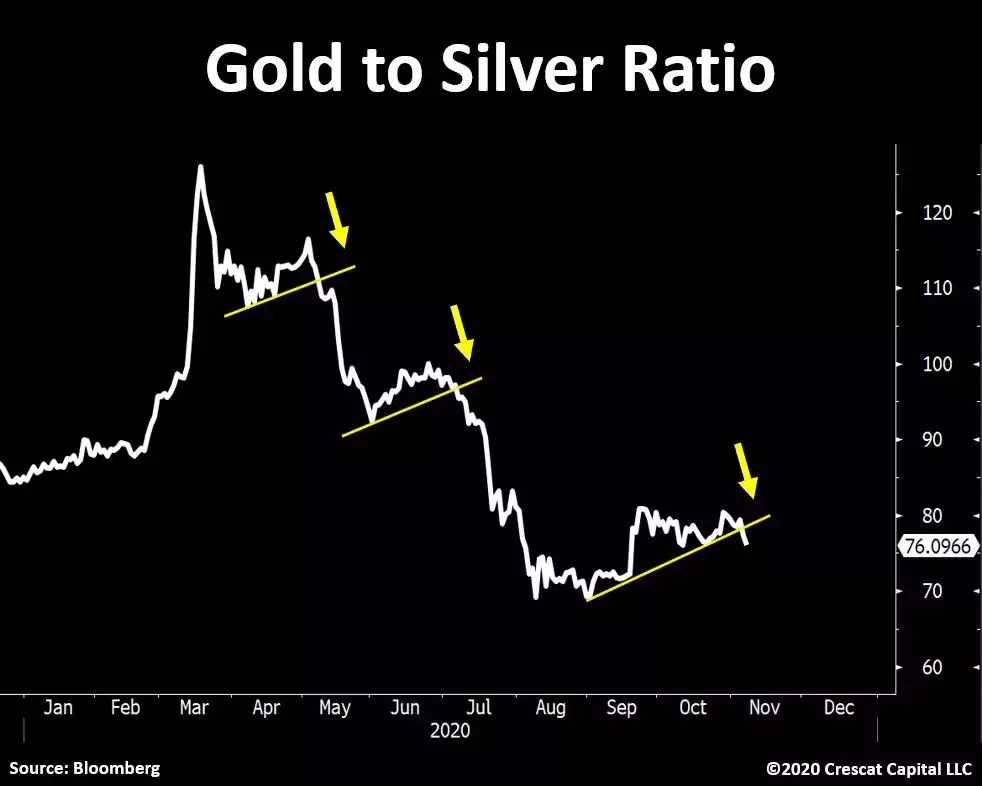
Since the gold silver ratio (GSR) hit that record all time high of 125 in March of this year we have watched it fall as expected but also pause now 3 times before breaking lower. The following chart may be showing that next leg down could be underway.

Crescat’s Otavio Costa mused on Twitter as to what might be the environment for silver’s next push:
“Political views aside... Here is silver last time Democrats won a presidential election during a major economic downturn. I know… “this time is different”…. It really is. Today we have a Federal Reserve on a suicide mission while fiscal deficits are 2x worse than back then.”

His point of differentiation of now to 2008 is an important one. When Obama took the Whitehouse the US was in the throes of the GFC but before the new ‘tool’ of QE was unleashed along with fiscal spending seeing some of the biggest deficits in US history. The stimulus gun was fully loaded and being fired to full effect. Fast forward to Biden and we have another recession but this time the gun is nearly empty having fired nearly all its bullets, interest rates at zero, US debt at record highs, and the catalyst for the recession is coming back with a bigger second wave whilst sharemarkets (at record high valuations) have fully priced in a vaccine enabled full recovery.
The beauty of silver is that it presents somewhat of an each-way bet. As a 50% commodity it also enjoys the fruits of the ‘reflation trade’ that will inevitably come once things bottom out. It is always important too to remember the relatively small size of the silver market and the effect a rotation of big money into it can have.
Ted Butler puts that into perspective with regard to the massive inflows into ETF’s and COMEX this year:
“By far, the most important silver statistics concern the inflow of some 400 million oz of physical metal into the world’s silver ETFs and into the COMEX silver warehouses, from roughly March 16 thru the end of July. Over little more than four and a half months, 330 million oz came into the world’s silver ETFs (220 million oz into the largest silver ETF, SLV), with 70 million oz coming into the COMEX warehouses (of which 30 million oz came into the JPMorgan COMEX warehouse).
Before explaining why I believe this 400 million oz inflow of physical silver was the most remarkable development of the year, let me acknowledge that there was also a very large physical inflow of gold into the world’s gold ETFs and the COMEX gold warehouses as well. Not only was the mix different than in silver, in that the roughly 60 million oz of physical gold inflow was evenly divided between the gold ETFs and the COMEX warehouses (30 million oz each), but the total gold inflow increased the total number of ounces in the gold ETFs and COMEX warehouses by 60% to 160 million oz, whereas the 400 million oz total physical silver inflow increased total ETF and COMEX warehouse totals by “only” 36%, from 1.1 billion oz to 1.5 billion oz.
Moreover, the 60 million gold ounces were worth well over $100 billion, whereas the 400 million ounces of physical silver were worth “only” $7 billion (at the prevailing prices at the time of the inflows). So where do I get off claiming that the inflow of 400 million oz of physical silver is the most remarkable statistic of this most remarkable year? It has to do with how much gold and silver exist in the world in bullion form.
In gold, there are 3 billion ounces of bullion in the world (out of a total of 6 billion oz in all forms). The 60 million oz of gold bullion that flowed into the world’s ETFs and COMEX warehouse inventories, therefore, represent 2% of the total amount of gold bullion in the world. In silver, the 400 million oz of physical metal that flowed into the world’s ETFs and COMEX warehouse inventories represent 20% of the 2 billion oz of world silver in bullion form (all in 1000 oz bars). There is a very big difference between 2% and 20% - a tenfold difference. Wait, I’m not finished.
The 160 million total oz of documented gold now in the world’s gold ETFs and COMEX warehouses represent just over 5% of the 3 billion oz of gold bullion known to exist. In silver, the 1.5 billion ounces in the world’s silver ETFs and in the COMEX warehouses represents 75% of the 2 billion total silver bullion oz said to exist. There is an even bigger difference between 5% and 75% - a 15-fold difference.
I’m not saying that there’s not more than 2 billion ounces of silver in the world in all forms - I’m sure there is. I’m saying that there are only 2 billion oz in industry standard good delivery 1000 oz bars and three-quarters of that silver is in the world’s ETFs and in the COMEX warehouses. Converting whatever silver that exists outside the 2 billion oz in 1000 oz bar form will take time, great gathering and processing expense and the willingness of those holding other forms of metal to sell – not something currently occurring or likely to occur in the absence of sharply higher prices.
At this time and price, 75% of all the silver bullion thought to exist is locked up in the worlds publicly-traded ETFs and COMEX warehouses, leaving only 25% as conceivably available (if the owners are willing to sell). No knock on gold intended in any way, but roughly 5% of the gold bullion in the world is locked up in ETFs and COMEX inventories, leaving 95% of the remaining gold bullion technically available. Plus, on a realistic basis, much more gold held in non-bullion form is likely to come to market at current prices than equivalent dollar amounts in silver.
It becomes even more remarkable when you think about 400 million oz of documented silver bullion suddenly coming into the world’s silver ETFs and into the COMEX warehouse inventories, in little more than 4 months. That’s the equivalent of 50% of annual world mine production (yes, the same could be said about gold mine production, but not existing gold inventories). Remember, silver is an industrial commodity and as such the vast majority of its annual production is used up in various industrial and other fabrication consumption, meaning no pricing model would ever allow for the equivalent of 50% of annual mine production to suddenly be taken away without a many-fold increase in price.”
Butler goes on to describe various theories around why the price didn’t explode at the time and even when it did take off in July, arguably not enough in the context of the above. Much of that revolves around J P Morgan’s role (leasing that silver to ETF’s not delivering it) and the use of the COMEX paper price as the determinant not the real physical market. On any level it appears to be a big silver coiled spring waiting for the scissors of physical supply & demand reality to cut the cord.
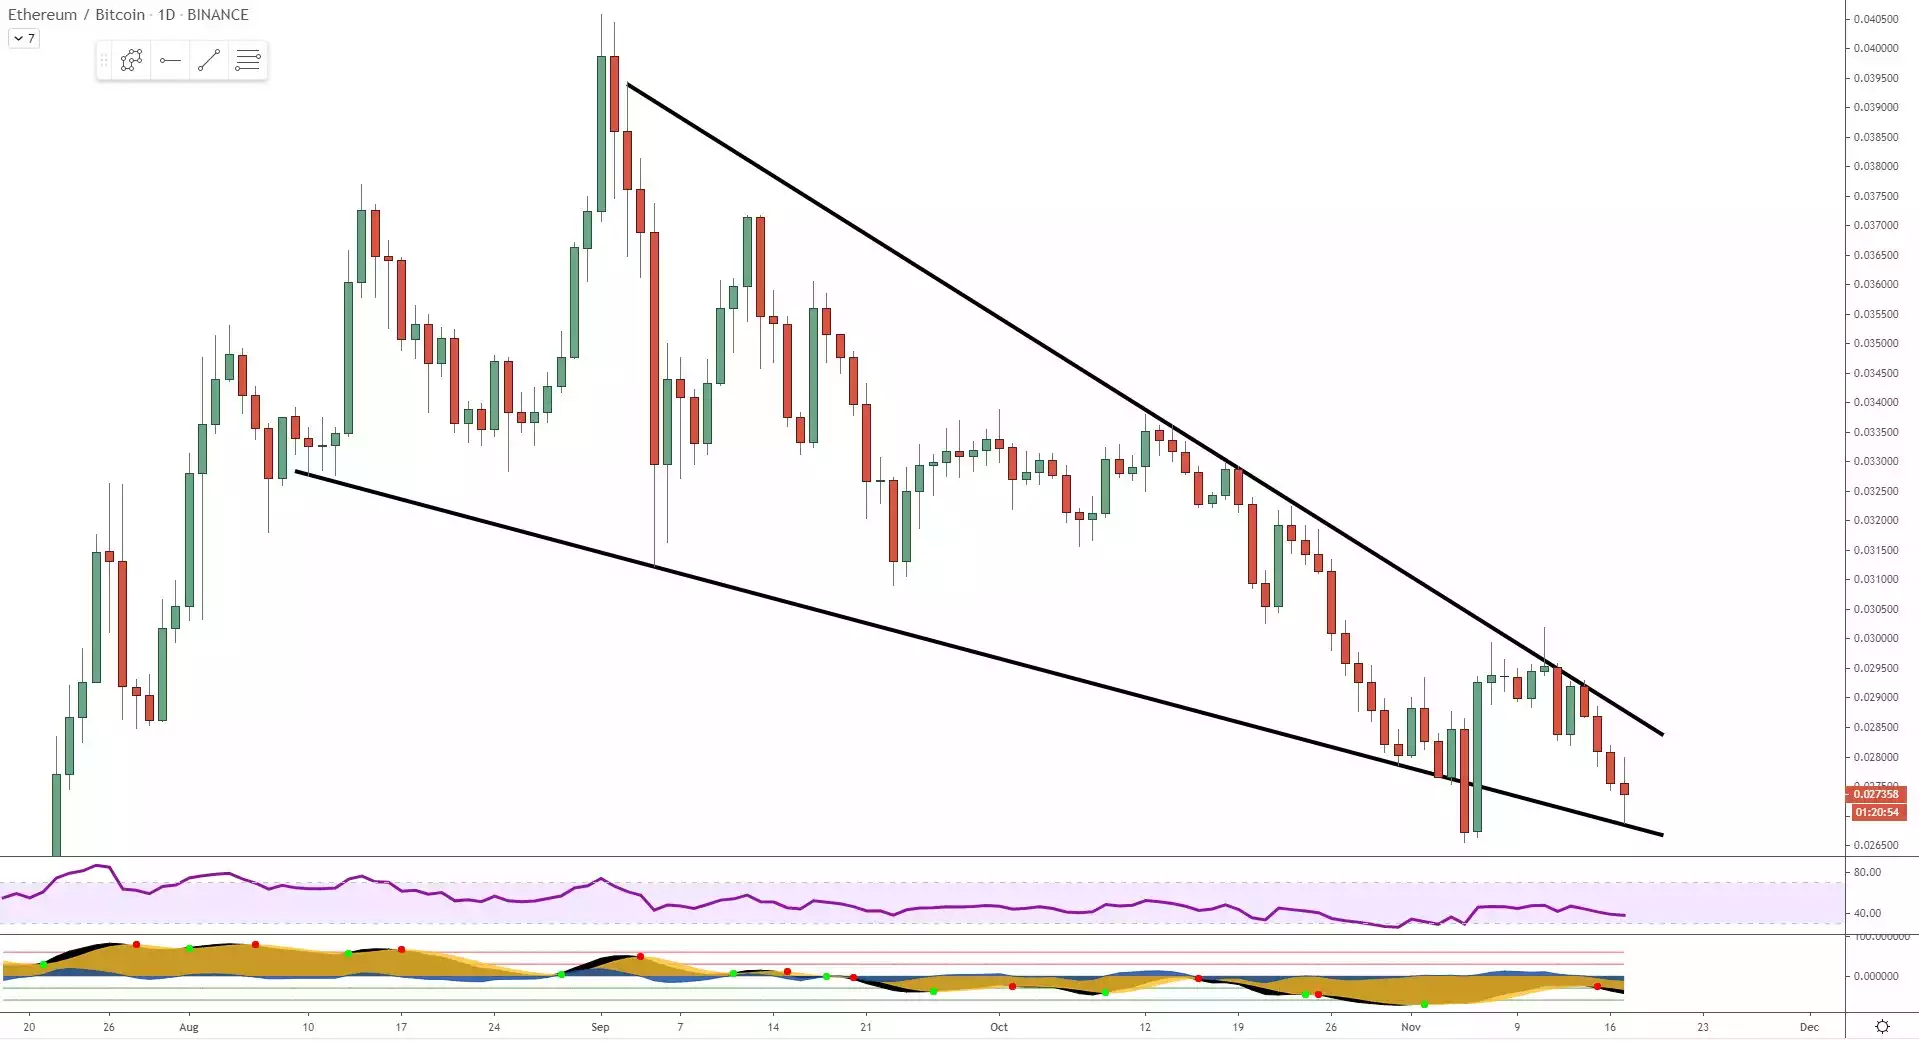
Finally, it would be remiss of us not to talk to the spectacular rise of Bitcoin, this week in particular. Bitcoin rose 15% in just 3 days. Ethereum rose 7% over the same time. As we have written before, Ethereum (ETH) is to Bitcoin (BTC) what silver is to gold. And just as we see in precious metals, when gold takes off you often get a lag before silver follows, but then it outperforms gold as the GSR falls. That has played out time and again in crypto markets as well. Alex Saunders of Nuggets News has been warning of this rotation coming for a little while now, most recently sharing the following ETH/BTC chart (which should be read on a like for like as the inverse of the Gold/Silver GSR):

He is firmly of the view we will see the rotation of BTC profit taking into ETH any time soon and a breakout to the upside out of that wedge. With BTC coming off a little last night we may be about to see it. As always, perspective is everything and the chart below shows ETH’s journey since it hit $2000 in 2018…

What is different now is the emergence of the DeFi giant which almost entirely runs on the Ethereum network and now the much anticipated ETH 2.0 being rolled out on 1 December…
----
For those avid followers of the GSR, in the coming weeks we will be launching a Gold Silver Ratio Bundle on CoinSpot using our Gold & Silver Standard tokens. The bundle allocation will be reweighted on a weekly basis inline with algorithms taking the historic trends of the GSR over the last 30 years. On the basis of mean reversion and history ‘rhyming’ the bundle aims to optimise value growth in a portfolio of both gold and silver. We will release more details closer to launch.