Silver Is Rallying. Is A Pullback Next?
News
|
Posted 13/08/2026
|
1697
Key Takeaways
- Silver has rallied hard through early-to-mid August 2026, but some cycle analysts see the move as stretched in the short term.
- A precious metals cycle framework points to a possible pullback window before flagging a bigger move higher.
- Weakening US jobs data and cooling inflation add to the case for eventual Fed rate cuts, though the Fed is unlikely to move while equities hold near record levels.
- Elevated oil prices are a wildcard: one closely watched recession indicator is elevated but hasn't yet crossed its historical warning threshold.
Silver has had a strong run over the past week, touching a six-week high near US$64 an ounce on 7 August 2026 after a weaker than expected US jobs report cooled expectations of further Fed rate hikes. Shorter-term traders have piled in on the momentum.
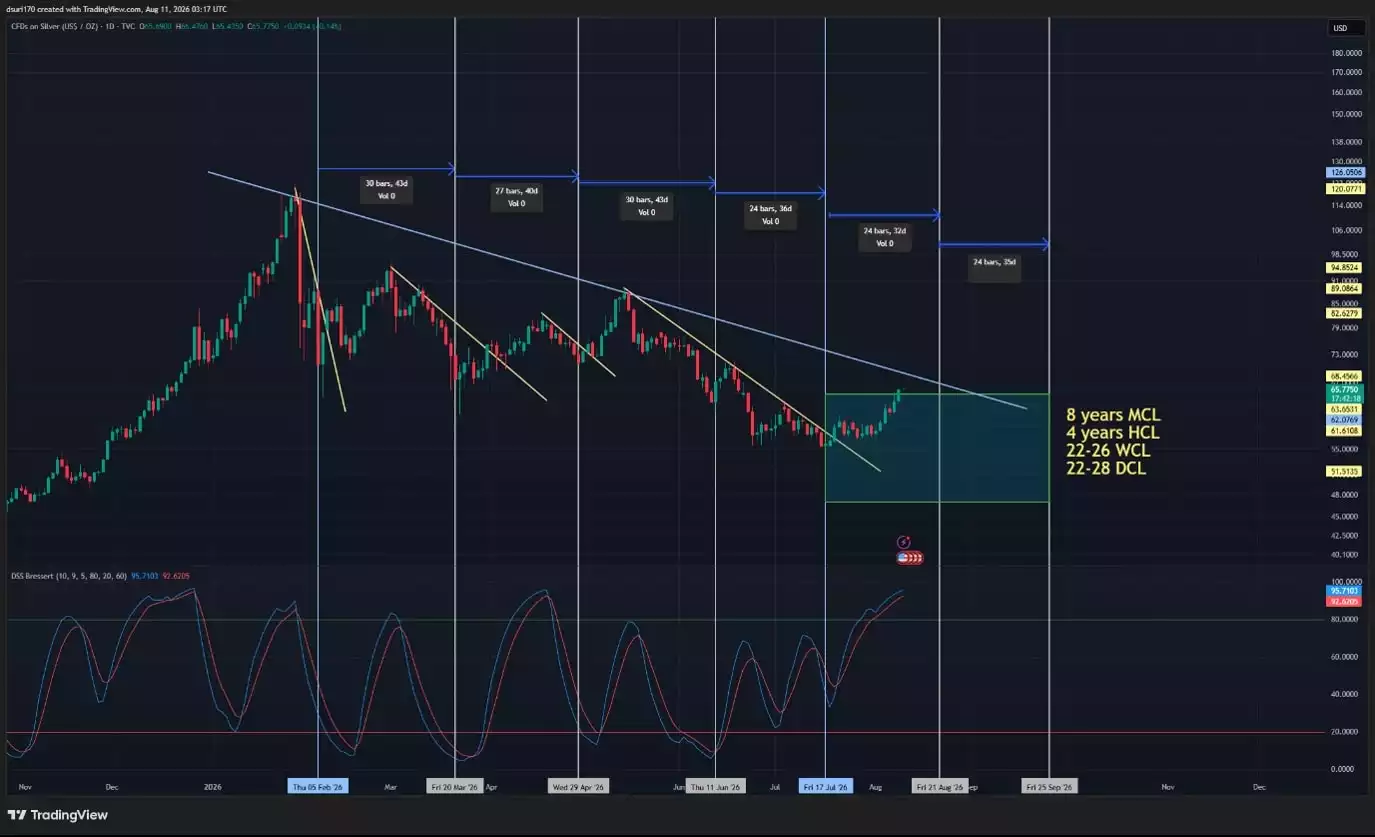
Some cycle analysts are reading the same chart differently. Using a framework that tracks an eight-year cycle in precious metals (dated from late 2022), they argue silver is now roughly four years into that cycle and entering the window where a “half-cycle low” typically shows up, a pullback before the next leg of the broader trend. On this reading, momentum has been rolling over after rallying directly into a macro trendline, which is what has this cohort watching for a near-term dip rather than chasing the rally.
Why The Second Half Of The Cycle Matters
The first half of this cycle (2022 to 2026) has played out while cash and bonds offered relatively high yields, competing for investor capital and acting as a headwind for precious metals. If the second half arrives alongside falling yields and rate cuts, that headwind could ease and potentially add fuel to the current rally in gold and silver. That's the thesis; it isn't a given.
There's a genuine case for falling yields building, though it's not clear-cut:
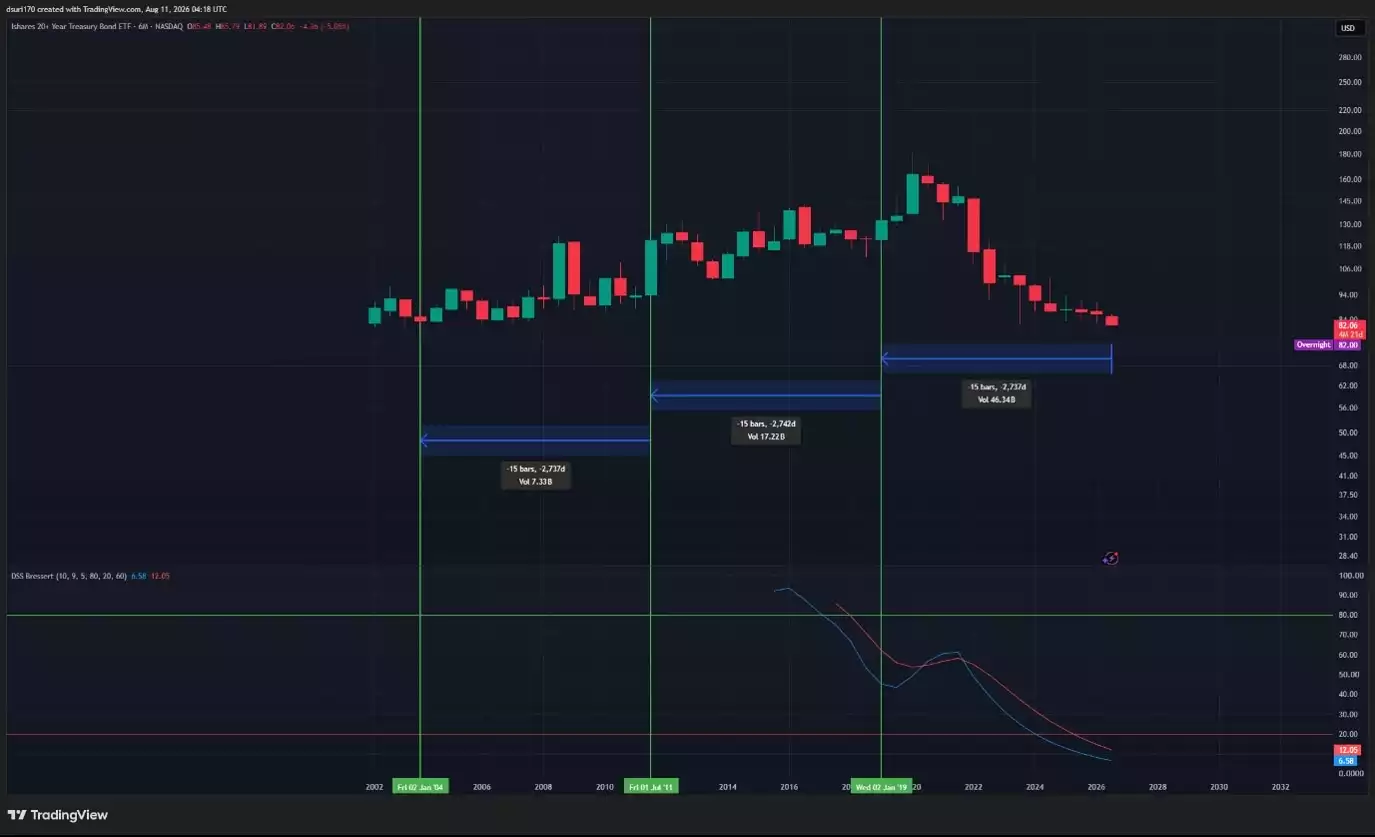
- Bonds: Long-dated Treasuries (tracked via the TLT ETF) traded close to their October 2023 low in July 2026, and some analysts see room for a bounce toward the upper end of the multi-year trading range. Set against that, long-term yields have actually risen over the course of 2026, so the “falling yields” case isn't yet showing up in the yield itself.
- Jobs data: The headline unemployment rate actually eased to 4.1% in July 2026. The detail was weaker though: nonfarm payrolls fell by 23,000, the first outright decline in months, and labour force participation dropped to its lowest level in over five years.
- Inflation: Annual CPI cooled to 3.4% in July 2026, down from a recent high of 4.2% in May, largely on falling energy prices.
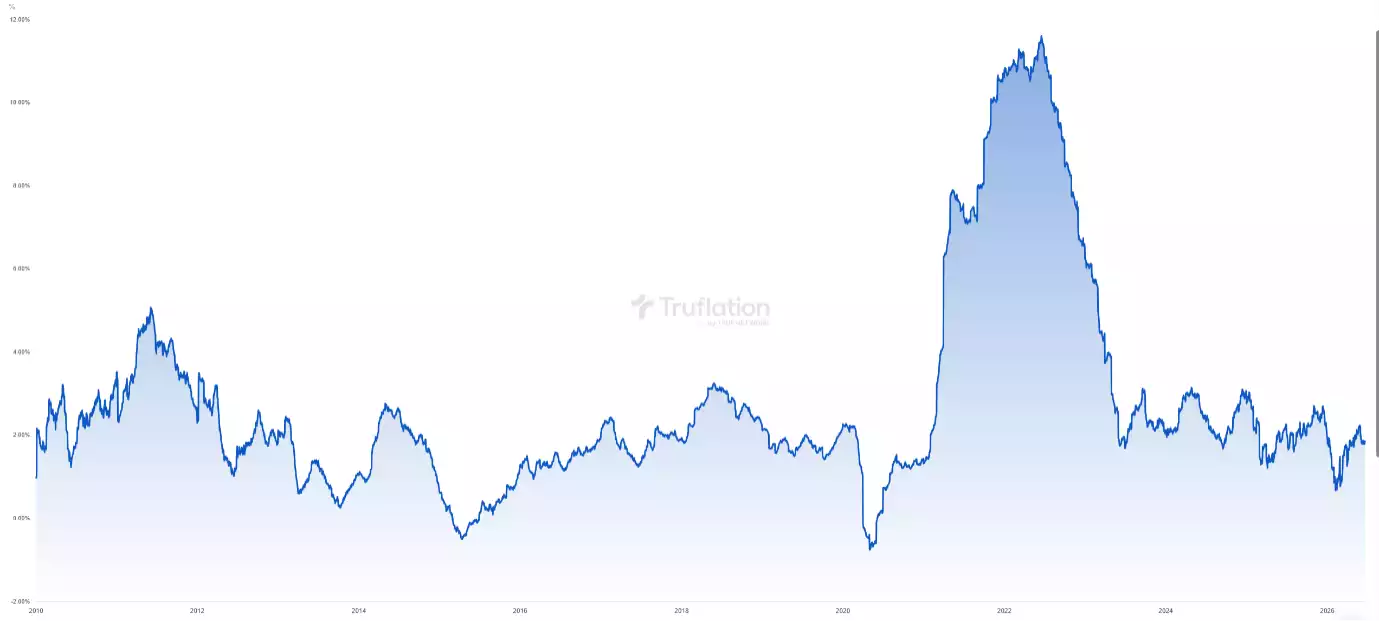
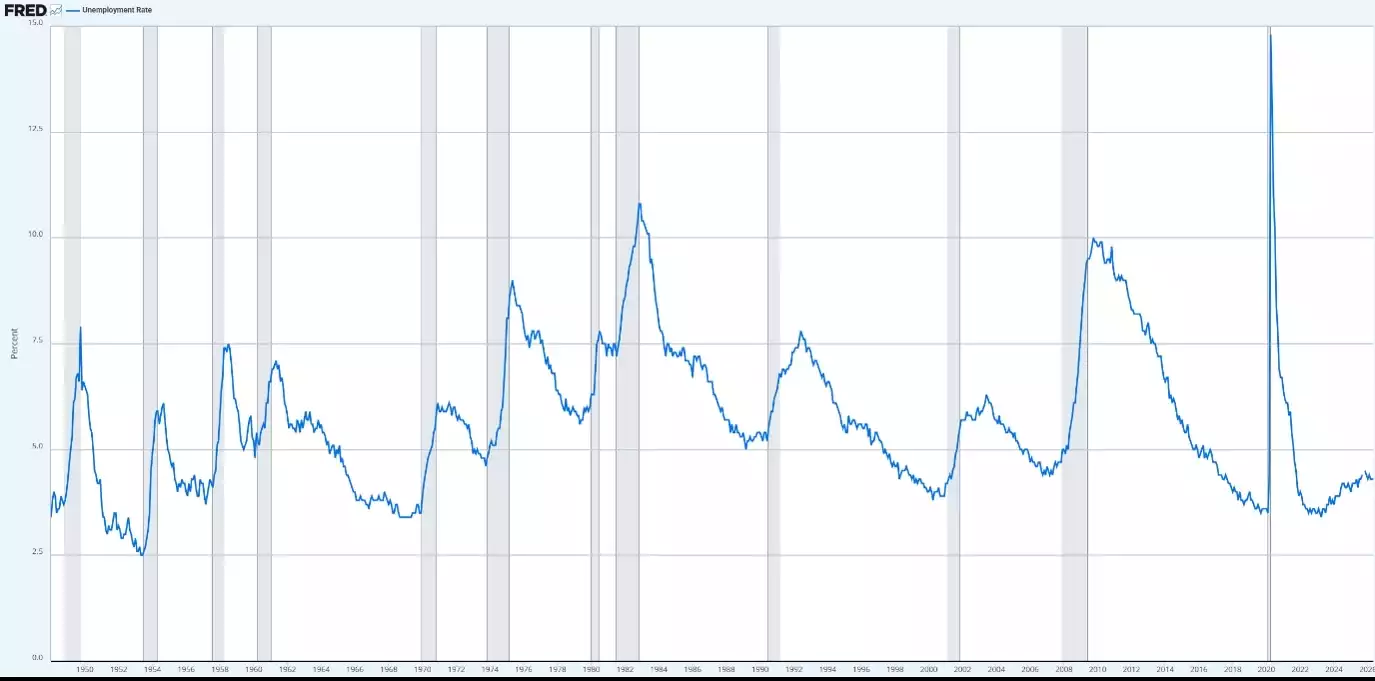
Taken together, that's a softer labour market and cooling inflation, a combination that has historically supported a more dovish Fed. That said, a Fed pivot while equities are still near record highs would be unusual; historically, rate cuts have tended to follow weaker equity markets, not accompany a strong rally.
Oil Is The Wildcard
Crude oil surged through the first quarter of 2026, with Brent rising from around US$61 a barrel in January to above US$118 by late March, after conflict in the Middle East disrupted shipping through the Strait of Hormuz.
Some analysts, including DataTrek's Nick Colas, watch oil's 12-month rate of change as a recession signal: historically, whenever it has crossed 100%, a market downturn has followed, including 1987, 1990, the dot-com bust, 2008 and 2022. The reading has been elevated through 2026 and sat close to that threshold earlier in the year.
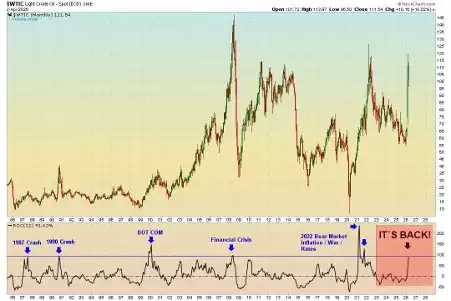
A steady rise in oil prices tends to move through the economy gradually; a sudden spike is more likely to hit consumers directly at the bowser, which can act as a short, sharp brake on spending.
Some of the same analysts also point to equities working through their own four-year cycle low into late 2026 or early 2027, alongside a long-cited 18.6-year land cycle reaching a comparable point. If those cycles line up, it could mean broader volatility across markets, not just precious metals, though this is one interpretive framework among several ways to read the current setup.
What It Means For Investors
None of this is guaranteed. Cycle analysis is one lens for reading markets, not a forecast. But gold and silver have historically drawn interest during periods of financial market stress, particularly where central banks respond with lower rates. For those looking to build a position through the cycle rather than time it exactly, Ainslie's silver bullion range remains available across a range of sizes.
This article is general information only and does not constitute financial advice. Past performance is not indicative of future results. Always conduct your own research or consult a licensed financial adviser before making investment decisions.