Shadow Economy Recession Adding to the GDP per Capita Recession
News
|
Posted 05/06/2025
|
4546
We’ve looked at the GDP per capita recession before and how Australia is one of the worst-performing economies in the world currently – hidden by record immigration, so the government can pat itself on the back for not having a recession at the expense of its constituents, who are becoming poorer and poorer. But what makes these numbers even worse is Australia’s shrinking shadow economy.
As cash usage has declined, and red tape has grown in Australia, the shadow economy has shrunk. In 2021 the shadow economy was estimated to be around 5.4% of GDP, today that number is much smaller around 2.7%. "Alongside the ongoing GDP per capita recession that began during COVID-19, the estimated contraction of the shadow economy likely contributed an additional 3% shrinkage to the overall economy. This all equates to us feeling poorer, whilst housing prices pole vault to new highs, making it increasingly difficult to live in Australia.
Tax Loss Decline – Estimating the size of the Shadow Economy
In the 2021-2022 financial year, the ATO estimated it lost around $22 billion in tax due to the ‘cash economy’, around 5.4% impact on the total tax. In 2024 the ATO put this estimate at $12 billion – indicating that there has been a reduction in people using cash to pay for goods and services, and therefore a reduction of around 50% in the shadow economy from 5.4% to around 2.7% in the last four years. Based on how little cash many people have on them; it seems like a good indication of the shrinking of this economy.
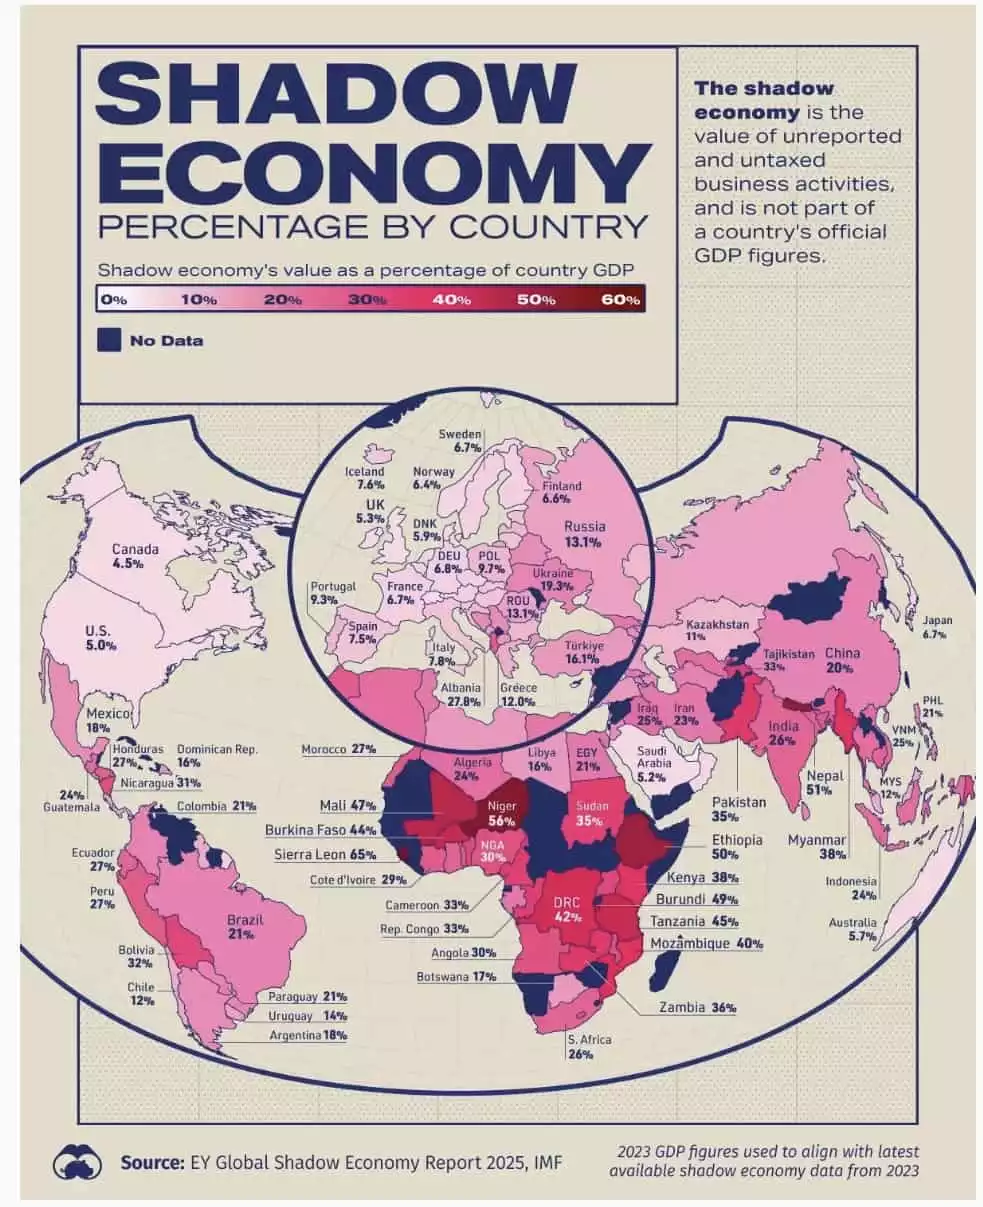
There are varying estimates on the size of the Australian shadow economy a recent estimate by EY put it at around 5.7% based on 2023 data. But with the 2009 data from the World Bank estimating it at around 14%, one thing is clear – the shadow economy in Australia (and worldwide) is shrinking. The reduction of cash in Australia is likely attributed to more red tape and compliance of using cash – with banks asking questions for any withdrawals over $5,000 being just one of them.

So, if the Shadow economy is shrinking are we even worse off than what is being reported adding to the woeful decline of the Australian Economy? If the data is accurate – over the last four years the Australian economy has shrunk an additional 2.7% or 0.6% per annum.
Cash Decline
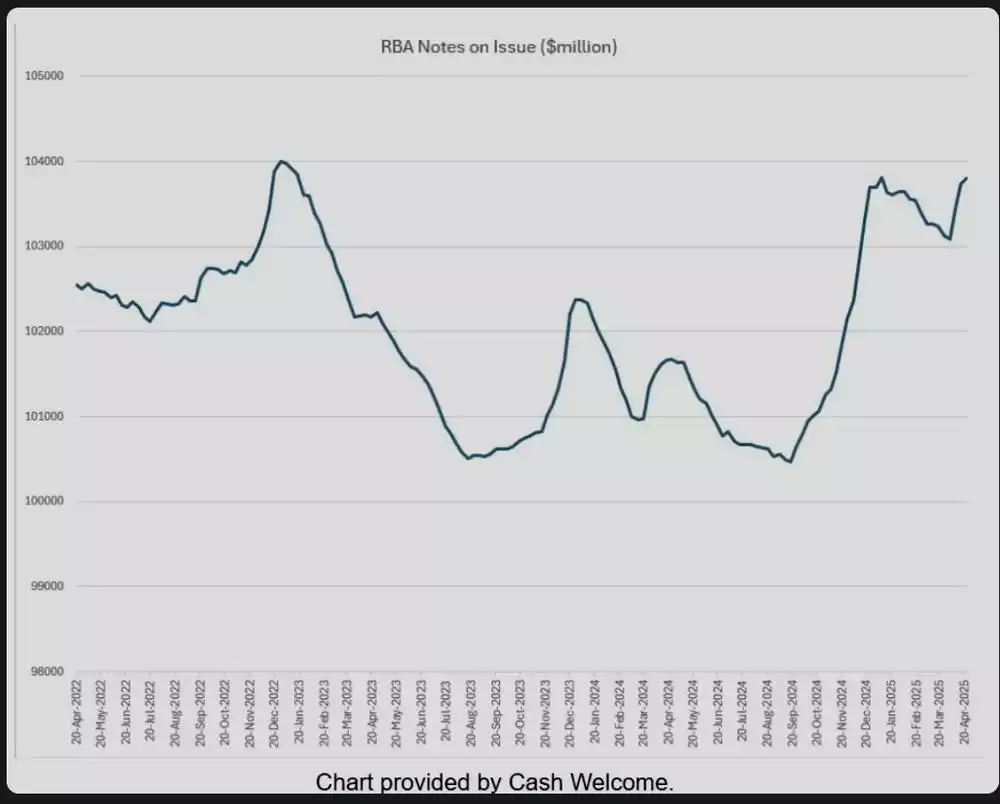
Supporting the argument that there has been a steep decline in the shadow economy is recent data on cash per person in Australia. Although cash in circulation is at a record high, and cash withdrawals rose in 2024, cash in circulation per person continues to decline from a peak of $3,987 in 2021 to its current March 2025 level of $3,750.

GDP and Shadow GDP per Capita Recession
Today’s quarterly GDP figures were even weaker than expected, revealing a continued decline in GDP per capita. GDP growth rose by just 0.2% — below the forecast 0.3% and down from 0.4% in the previous quarter — bringing the annualised GDP growth rate to a disappointing 1.5%.
With migration last year of around 500,000 people (about 1.7% of the total population of 27 million), this means GDP per capita has likely fallen by around 0.2%. Factoring in the estimated contraction of the shadow economy, the annual GDP per capita decline could currently be as high as 1%.
So, buckle up and invest in something that won’t erode your wealth – 1% per annum doesn’t take long for the government in charge of the banana economy to take everything.
Watch the insights video inspired by this article here: https://www.youtube.com/watch?v=Qb7pr4SLIBM