Secular Bear Market - Is this the start? Recession or Depression?
News
|
Posted 03/07/2020
|
23270
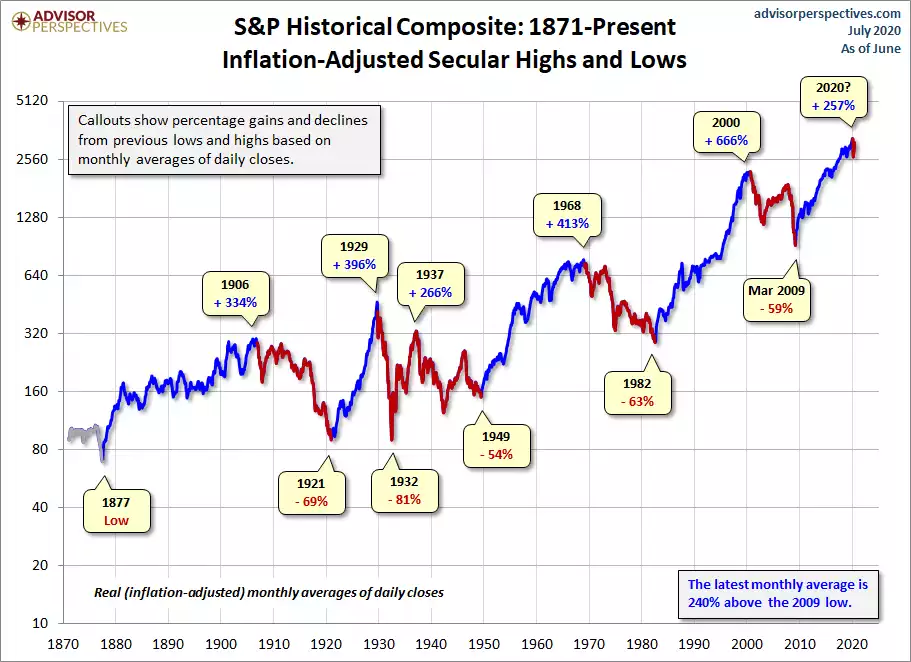
When we talk about bull markets and bear markets we often get swept up in the present without stepping back and looking at the bigger picture. In this sense we tend to look at cyclical market trends as opposed to secular, derived from the Latin word for long term. The accepted metric for a cyclical bull or bear market is reaching 20% from a recent low or high. Secular bull markets consist of secular trends that lead to new all-time highs irrespective of intervening cyclical lows or highs. The chart below maps out all secular bull and bear markets since 1871 in inflation adjusted terms for the US S&P sharemarket index. It assumes, though it is yet to be proven, that we have begun the next secular bear market from the February of this year.

Probably the clearest, if not controversial application of this definition is the period started by the Great Depression. As you can see from the chart above whilst there was a 266% rally from 1932 to 1937, it did not see a new all-time high before it fell through to 1949.
What the chart above also debunks is what seems to be the current belief (particularly amongst the Robinhooders) that downturns are short lived and every dip is to be bought. The authors of the above chart, Advisor Perspectives, analysed these secular markets from 1871 to that last March 2009 low with the results below:
- “Secular bull gains totaled 2075% for an average of 415%.
- Secular bear losses totaled -329% for an average of -65%.
- Secular bull years total 80 versus 52 for the bears, a 60:40 ratio.”
So in other words bear markets on average account for around 40% of total market time. Now clearly the 1932 to 1937 period was an opportunity to be had to make serious money in a ‘bear market’ but from a long term investment perspective, you were worst off through to the end in 1949. As a side note their study reference another that bases secular markets on the more fundamental P/E ratio and concludes we are still in a bear market that started in 2000, with the rally ending this February being the biggest cyclical bull rally inside a secular bear market. The implications are therefore that the next low will be much lower than the 2000 high.
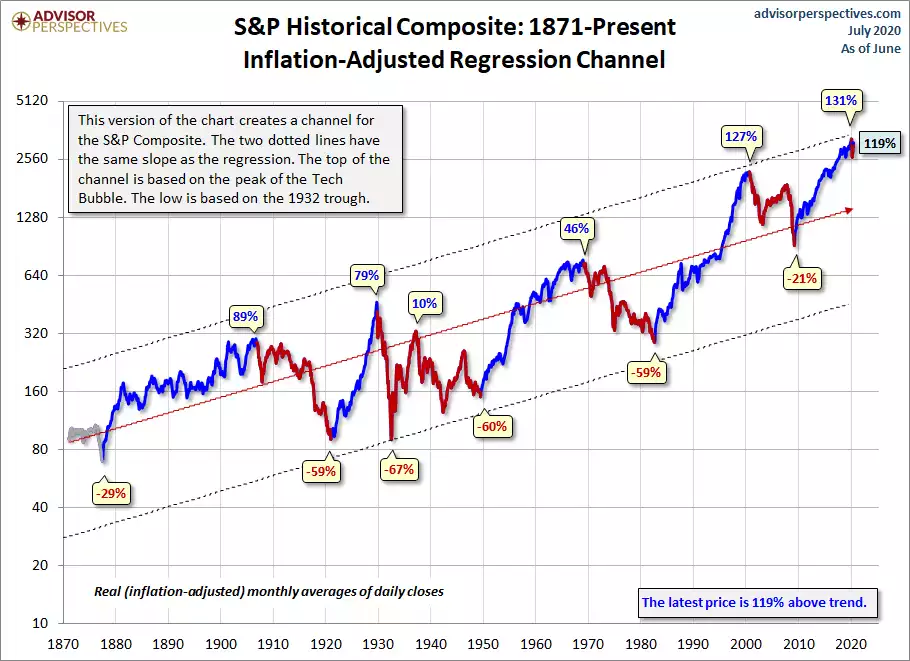
To put all of this into perspective and look for some indication of where it might end, they then add a regression line which is “a "best fit" that essentially divides the monthly values so that the total distance of the data points above the line equals the total distance below”. This tells us where we are now historically, i.e. 119% (more than double) above the ‘average’. Interestingly that regression line represents an average of just 1.87% annualised growth rate, such is the power of that 40% bear market in wiping off all those bull market gains. They then add an historic upper and lower channel based on the (all-time champion) top of the dot.com tech bubble and the bottom of the (all-time loser) Great Depression respectively.

To spell out the obvious takeaway from the chart above in cold hard numbers, amid all the speculation around whether the current recession will be a depression, if we were to revisit the projected levels on the last time this happened, we would be looking at losses of nearly 80% from today’s levels. To put that 1.87% historic annualised return into perspective and highlight again the implication of such a fall, you would subsequently need to realise a 465% gain from that bottom to get back to where you were before the crash.
Notable too is that in that last secular bear market from 2000 to 2009 where shares fell 59% (i.e. more than halved), gold rose over 240% (more than doubled)….
The question remains, are we at that turning point now and if so what does the bottom look like. The jury is still out too as to whether we should be talking about 2009 to 2020 as a secular bull or the biggest intra secular bear bull rally ever. That it was driven predominately through unprecedented central bank stimulus whilst presenting anaemic economic growth adds fuel to that theory. If so, we are potentially in for one hell of a plunge for the final bottom. We were struck by a succinct and compelling summary of where Australia sits right now in the recession v depression question by economist Stephen Koukoulas on Monday that we will leave you with:
“When the Governor of the Reserve Bank of Australia says that official interest rates are likely to remain near 0 per cent for many years, government tax revenue is undershooting forecasts by $20 billion and government spending is $50 billion above the forecast of just a few months ago, even Blind Freddie knows the economy is in huge trouble.
It is staggering and utterly dispiriting to see around 25 per cent of the workforce either unemployed, underemployment or having given up looking for work.
Those lucky to have a job are being subjected to pay freezes or pay cuts and many are on edge fearing their job will be the next to go.
Having stabilised after the early year slump, stock markets now look to be in big trouble as Covid-19 spreads around the world and policy makers flounder in their support for the economy.
In Australia, house prices are now falling. Not precipitously, but falling nonetheless as demand disappears from the closing of the borders and immigration cascades towards zero.
According to Treasury, in the 1930s Great Depression the unemployment rate peaked at just under 20 per cent. Wages fell, prices fell and government policy makers erred in keeping economic policy too tight for too long.
Does that look familiar?
What we are seeing now, here in 2020, is probably not a recession, it’s probably a depression.
October could be a disaster
Much has been written about how the JobKeeper program will be scaled back at the end of September and the JobSeeker payment will be cut.
The government says it is working on policies to help in the transition from these stimulatory measures, but it is obvious the amount of money going into the economy from government measures will be substantially smaller in the December quarter than in the September quarter.
That is just part of the problem.
In most States and Territories, the end of September will see the ‘no eviction’ policy end for renters of residential property.
The ‘no eviction’ rule was, alas, a half-baked response to the fact that people could not pay their rent whilst unemployed or wage less. That landlords, who were given a ‘mortgage holiday’ from their banks would keep their head above water and not have to kick people out.
When the ‘no evictions’ policy ends, it is probable that there will be a surge in people being evicted for not paying their rent and landlords potentially being driven to forced property sales to get themselves out of their financial difficulties.
The human tragedy is obvious.
The impact on consumer confidence will be sharp and negative.
The economy will also be hit by the ending of the ‘mortgage holiday’ – that is the decision of the banks to allow borrowers to defer making their monthly repayments on their mortgage. While repayments were postponed, debt was being accumulated.
When the repayment holiday ends, many borrowers will need to find many thousands of dollars a month to resume their repayment schedule, a task that for some will be impossible given they will be unemployed, their businesses have closed or their incomes have dropped.
What is an economic depression?
In one way, the label of ‘recession’ or ‘depression’ doesn’t matter much.
If you can’t find work, your business has closed, you are forced to sell your house, your wage is frozen or cut, interest rates are near zero and the budget deficit is exploding, it is bad news whatever the label attached to the situation.
There is no simple definition of what an economic depression is. Thankfully, they are not all that common which makes the task of defining one open to debate.
Most definitions focus on a large fall in economic output (GDP), that there is an extended period before the economy regains the lost output, the labour market has chronically high underutilisation and there is price and wage disinflation or deflation.
While the hard data on many of those variables has yet to be collated and published, the information that is available suggests that most of the boxes defining a recession have a tentative tick. The only point of debate is the duration of the current economic malaise.
Will it be just 6 months of economic pain?
12 months?
Or will we have several years where economic growth waxes and wanes at a low level of activity, where the labour market is characterised by high unemployment, underemployment and a low participation rate, when wages growth and inflation is weak?”