‘Safe As A Bank’ & ‘Bricks and Mortar’ v Gold – The Counterparty Conundrum
News
|
Posted 17/04/2020
|
24196
One of the key attributes of gold is its lack of counterparty risk. Such counterparty risk is usually spoken of in the sense that it is no one’s liability in the financial sense. However the Queensland government’s move yesterday to help renters at the expense of landlords highlights an asset can have other counterparty risks that may not be foreseen in ordinary times.
However let’s retrace to the traditional definition of counterparty risk. The biggest example is cash in a bank. This has traditionally been thought of as the safest form of holding your wealth. It has even coined the phrase ‘safe as a bank’. However the recent legislative changes around bail ins and cash bans (if you haven’t read about this you simply must here (bail in) and here (cash ban)) have a lot of people suddenly questioning that safety particularly as the banks appear increasingly more fragile as we head into possibly the worst recession on record. A cash depositor in a bank is an unsecured creditor of that bank. We have spoken previously of the massive influx of cashed up high net worth clients getting their deposits out of banks and into gold for this very reason over most of last year and continuing into 2020.
This same counterparty risk presents itself in gold and silver if you are in an ETF, shares in a company have the obvious counterparty risk of the performance of the management team let alone the company’s industry and of course trading halts and the like, bonds in the issuer’s solvency etc etc. You will be hard pressed to think of a single other asset class other than gold and silver that don’t have counterparty risk. Often the response to that question is residential property. Apart from the bank if you have a mortgage, property has often been thought of as a hard asset with no material counterparty risk.
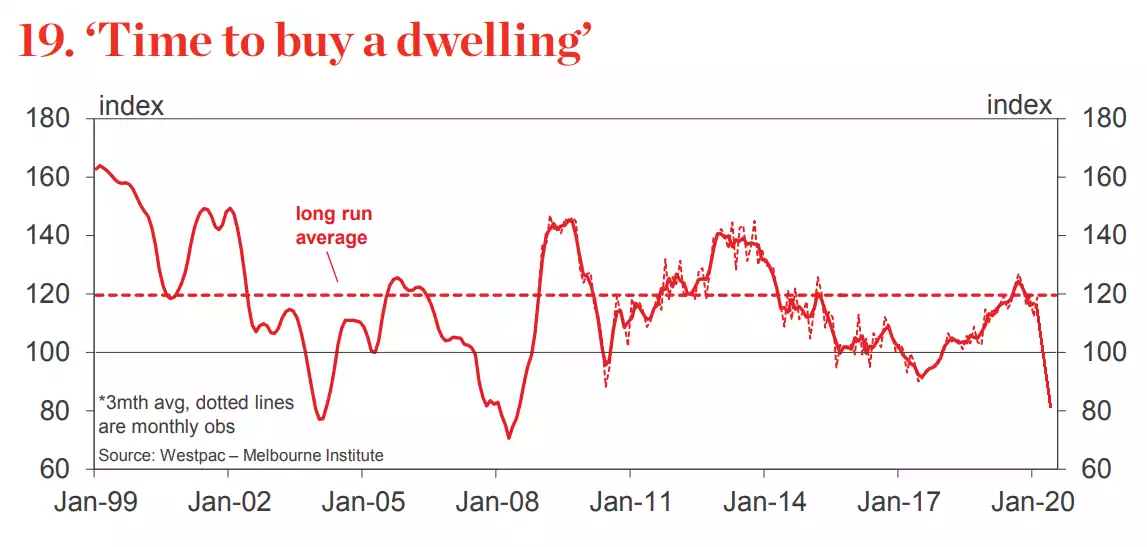
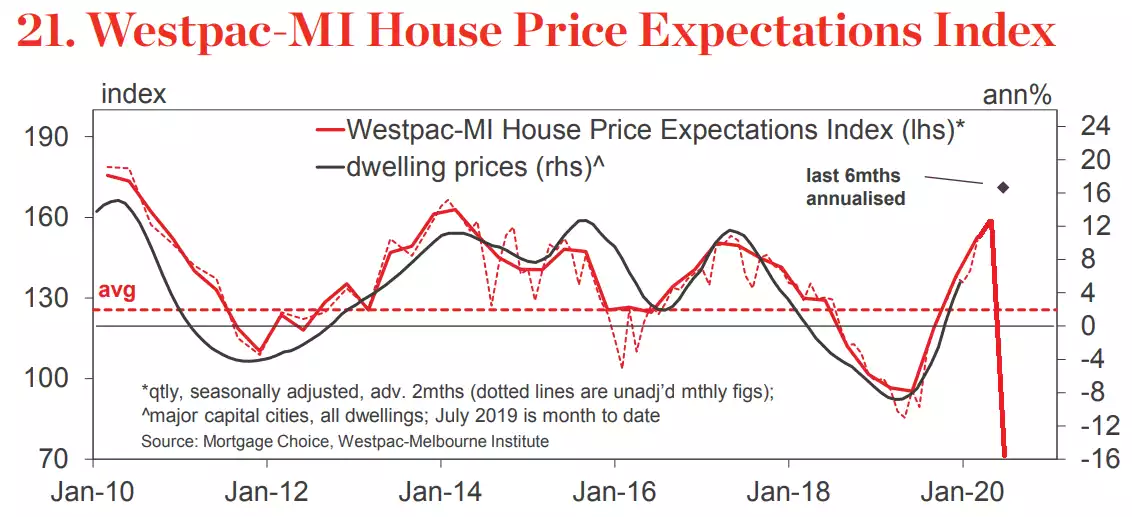
In the space of investment property, the Queensland government (and maybe a template for other states to follow) changed that by announcing it will push a bill to see a six-month freeze on evictions, a waiver on rental payments for 12 months (!), and a ban on non-essential inspections and maintenance. This comes of course as sentiment plunges, prices start to fall, and auction clearance rates plunge. Westpac this week released its latest consumer data revealing “Sentiment around housing collapsed in April with assessments of both ‘time to buy’ and ‘price expectations’ plunging to the most negative levels since the GFC. The drop was consistent across all major states.”


They went on to say:
“The ‘time to buy a dwelling’ index dropped 26.6% – the biggest monthly decline on record. That said, at 82, the index is still above the GFC low of 67.1 and previous cyclical lows in December 2003 (73.2), June 1989 (44.8) and September 1974 (61.5).” This of course portends more drops to come given the broader fundamentals of this recession over the one we didn’t even have in the GFC. Indeed people think the price has more to go…
“Consumer expectations for house prices fell even more sharply. The Westpac-Melbourne Institute Index of House Price Expectations Index dropped by over half (–50.8%) to just 69.7 in April. While this measure has a much shorter survey history, the fall is nearly four times bigger than the largest monthly decline since we started running the question regularly in 2009. Responses to a similar survey run prior to 2009 suggest the index level in April 2020 is comparable to the weakest reads seen during the GFC.”
Indeed the high correlation between auction clearance rates and price growth is painting a very clear picture…

UBS also gave a reminder of the broader implications not just on house prices but the construction of them in an already weakening market heading into a crashing market:
“Dwelling commencements in Q4-19 bounced by 1.2% q/q (UBS: -1.0%) to 166k annualised, albeit still down 15.2% y/y, and near the lowest level since 2013. Meanwhile, renovations (i.e. alterations & additions) commencements volumes also retraced (-4.0% q/q, -0.4% y/y). Looking ahead, we are materially revising down our forecasts (again). It is increasingly likely that mobility restrictions (specifically on housing) will remain in place over coming months; as well as a potentially even longer and more impactful drop in migration (with potentially effectively closed borders for many months, or even until next year). This is coupled with a severe recession lifting unemployment, and poor sentiment amid expectations of price falls. So far, there has also not been material enough policy support directly aimed at housing to offset these growing negatives. Hence, we now expect dwelling commencements to collapse from 174k in 2019, to around 120k in CY-2020 (was 140k), including a dip below 100k in coming quarters, which would be the lowest level since at least 1960. We then assume some easing of mobility restrictions to allow a rebound to 170k in 2021 (unrevised). Given the focus of the prior boom in demand from foreigners was buying high-rises, we expect much of this looming correction to be multis, rather than free-standing houses. Meanwhile, we also expect house prices to decline at least 10% in the coming year, in line with our ‘full pandemic scenario’. Indeed, without an easing of mobility restrictions, and/or more direct policy support, the price falls will likely be larger.”
There are a number of takeaways in that piece. In talking to government support it omits this subsequently announced government penalty (the opposite of support) and its effects. Australia is largely a 2 trick pony – resources and housing. In a global recession or depression we don’t need to remind you where resources is going. Selling resources to China saved us from recession during the GFC but they can’t in this one. Housing saved us when resources crashed afterwards, but it can’t this time. What’s left you say? Well it’s certainly not tourism and we long ago let manufacturing die.
The implications of a crashing property market are therefore massive. We have the highest personal debt in the world and much of that in property. Our banks are more singularly exposed to the domestic property market than any other in the world and our sharemarket more dominated by these very same banks than any other in the world.
It is this equation having big money leave the fragility of the banking system and into the counterparty free world of gold and silver.
In reality investment property always had the counterparty risk of bad tenants but it was a “known unknown” as risks go. What the Queensland government have done is introduce the reality of the “unknown unknown” to the equation. What this crisis is also highlighting is the illiquidity of an investment property during a crisis. Gold can be sold any time in any market in small amounts as you may NEED not necessarily WANT.
There are a myriad of reasons why gold shines in times of crisis, sometimes only hindsight reveals them all.
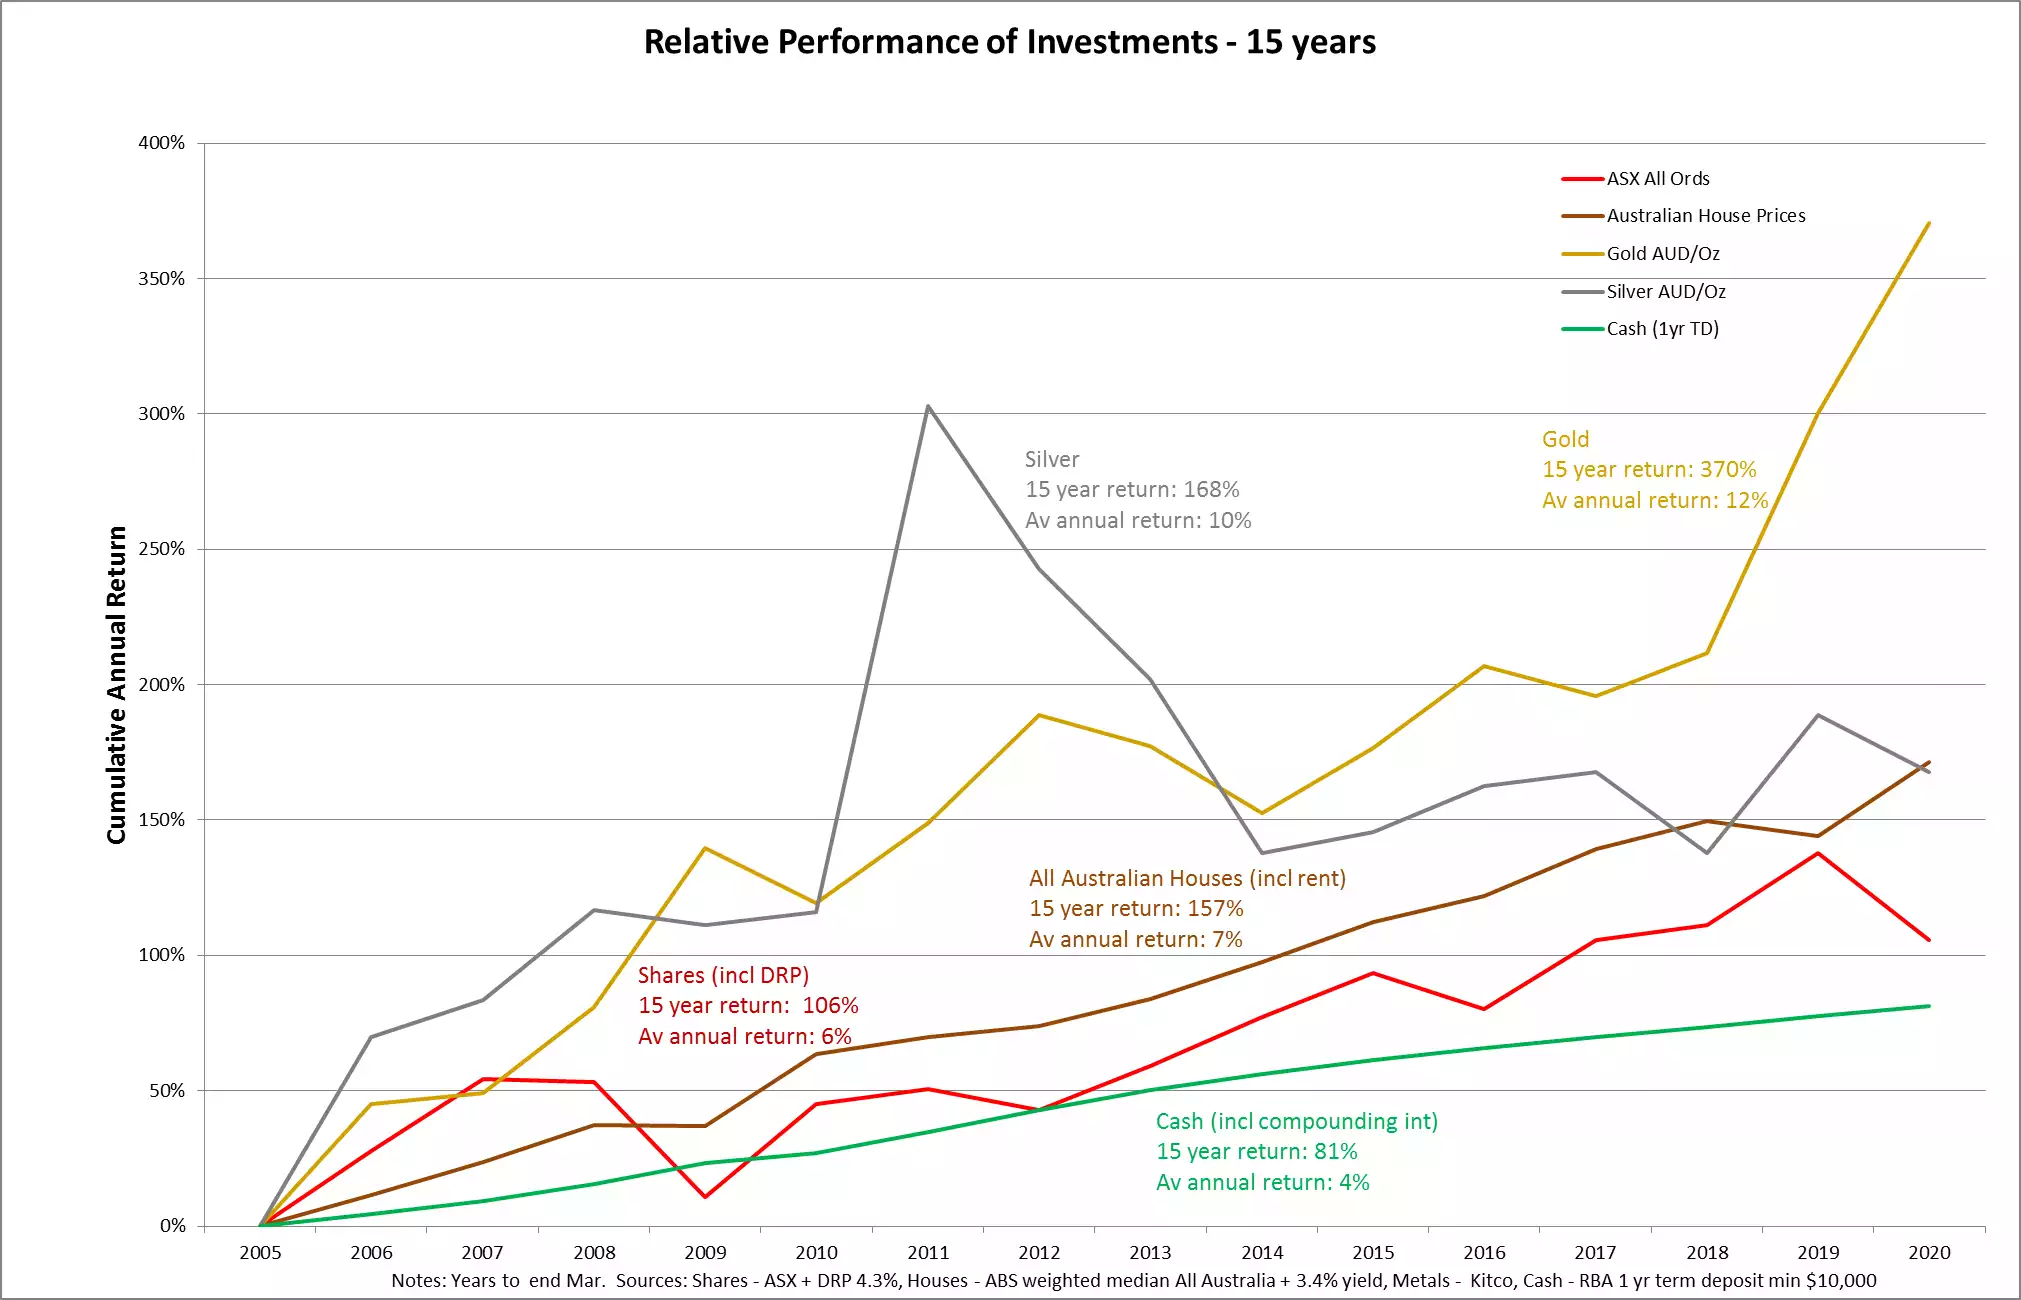
Topically, given it is April and comparing assets, we have updated the 15 year performance chart for Australian assets. For newcomers this chart removes the ‘gold doesn’t yield’ argument by levelling the playing field with annual dividend reinvestment on shares, compounding rental yield on houses, and compounding interest on $10,000 in a 1 year term deposit for cash. For full disclosure we don’t have the ABS figures for housing beyond the December quarter yet and so have conservatively extrapolated from that.
As you can see gold, without paying a yield, has outperformed everything by a large margin. Silver had its big correction in March and so is languishing a little bit as it lags the bull gold market just like it did before exploding past in 2011. With the GSR now at 110 that’s looking tantalising again…
