Risk Markets About To Rally?
News
|
Posted 14/05/2025
|
1406
As the panic from the US and the retaliatory tariffs subside - and we move closer to the typical timing window for a peak in the 18.6-year land cycle - are we on the verge of witnessing a final blow-off top in risk markets before a broad-based financial collapse?
This final phase of the cycle - aptly coined the “winner's curse” - is marked by increased leverage and complacency amid most markets rising together. This is where investors “win” so much that they lose sight of risk management, just in time for a financial crash. The last one was the Mortgage-Backed-Security crisis of the 2008 GFC, roughly 17 years ago.
Anecdotally, this cycle timing also lines up with a US president who has promised his citizens that they would “win so much”, that they would get “tired of winning”, while also recently encouraging them to go out and buy stocks as he expects them to go vertical.
While the president's words and actions certainly influence markets, and president Trump has a good track record of getting what he says done, rather than taking politicians at their word, let’s instead analyse the charts for land, S&P 500, and the Russell 2000 to help ascertain where we currently sit in the macrocycle – and what we might expect looking forward.
S&P 500
After a major sell-off amid tariff panic, we can see a strong recovery taking shape on the S&P 500. A strong bounce off the 50% level of the entire range from the 2022 liquidity cycle low to the all-time high indicates the bullish structure is currently intact, with a V-shaped recovery in progress.
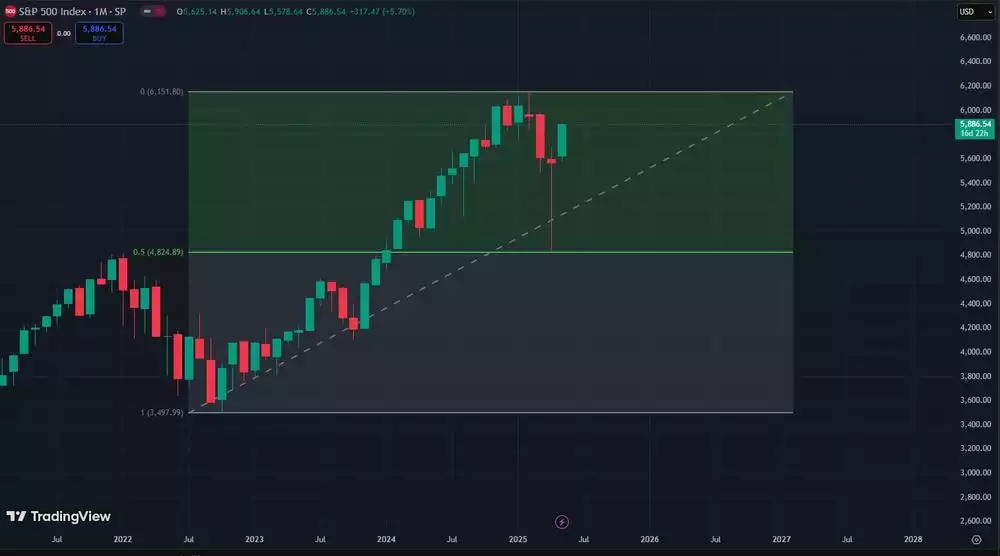
A massive bullish hammer monthly candle isn’t something to be ignored and shows significant buying pressure in the current market.
However, it is important to note that while the current price structure is bullish, this rally could always be a bounce to a macro lower high. While this seems unlikely given the current technical and macro setup, it is prudent to remain vigilant, as we approach the all-time high price, to be on the lookout for a decisive break, and hold above the all-time highs for a final confirmation of a macro uptrend continuation.
Land Markets
Similar to the S&P 500, the land markets (tracked using the homebuilders ETF) also corrected exactly to their 50% level of the range from the 2022 liquidity cycle lows, bouncing off this level, showing bullish structure currently intact.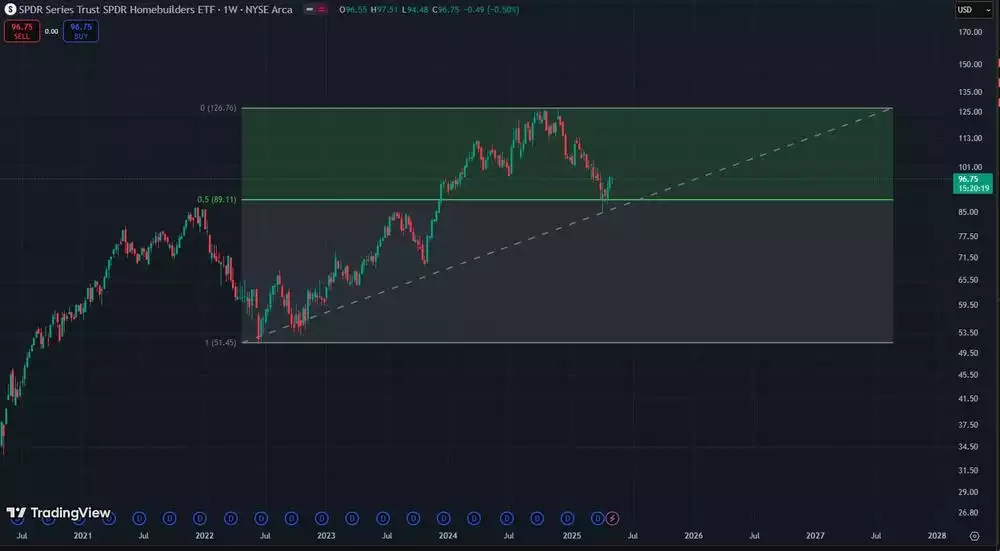
However, it is noteworthy that the homebuilders ETF has not bounced off this 50% level with the same intensity as the SP500, indicating relative weakness. This can be interpreted as an early warning sign that we are in the final stages of the 18.6-year land cycle, where land markets start falling off, while stocks continue towards the peak.
Land vs Stocks
We can see in the final 20 months of the previous 18.6-year cycle, leading into the GFC, the land markets began their downtrend while the SP500 continued upward.
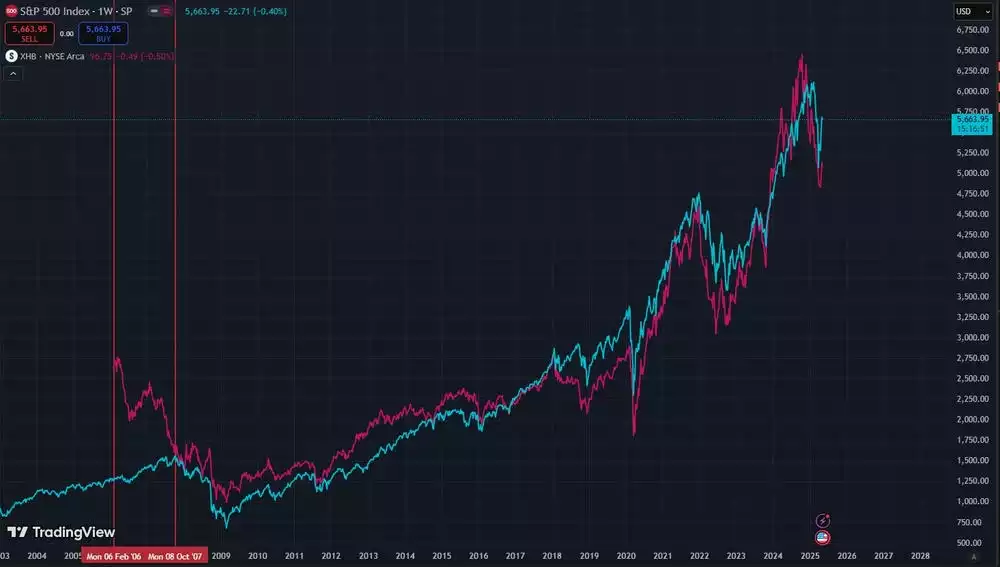
With the land markets showing relative weakness to the S&P 500 today, we could be seeing the early signs of this divergence building.
DXY
The DXY is expected to continue its own macro downtrend, in this final phase of this cycle, providing a tailwind for most markets to rise together.
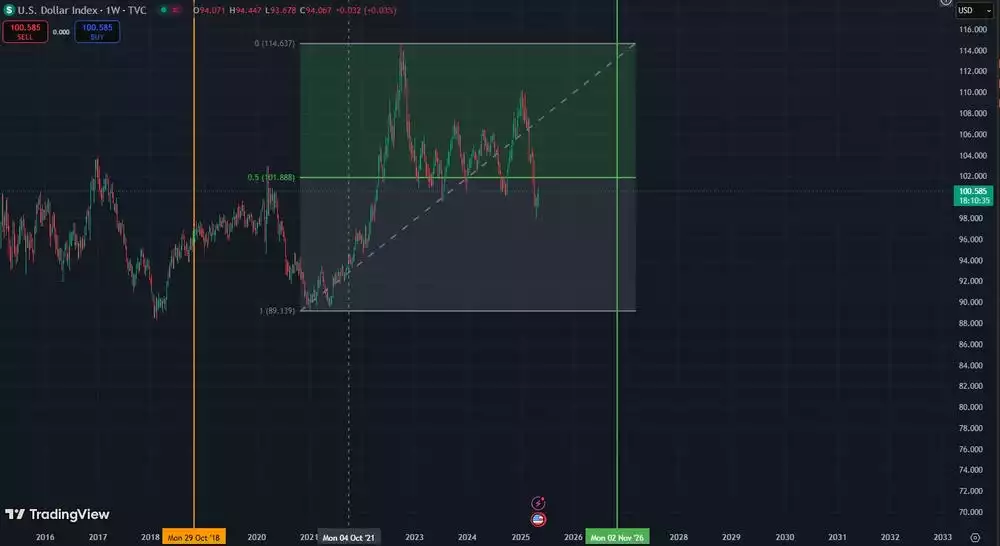
Today, we see the DXY breaking below its own macro 50% level from the range formed from the previous liquidity cycle peak of 2021, signalling technical weakness with a high probability of continued downside. While nothing goes down in a straight line - and a counter-trend rally should be around the corner for the DXY - a macro downtrend remaining intact would be in line with expectations, which usually correlates with a rally in risk assets.
Russell 2000 Small Cap Index
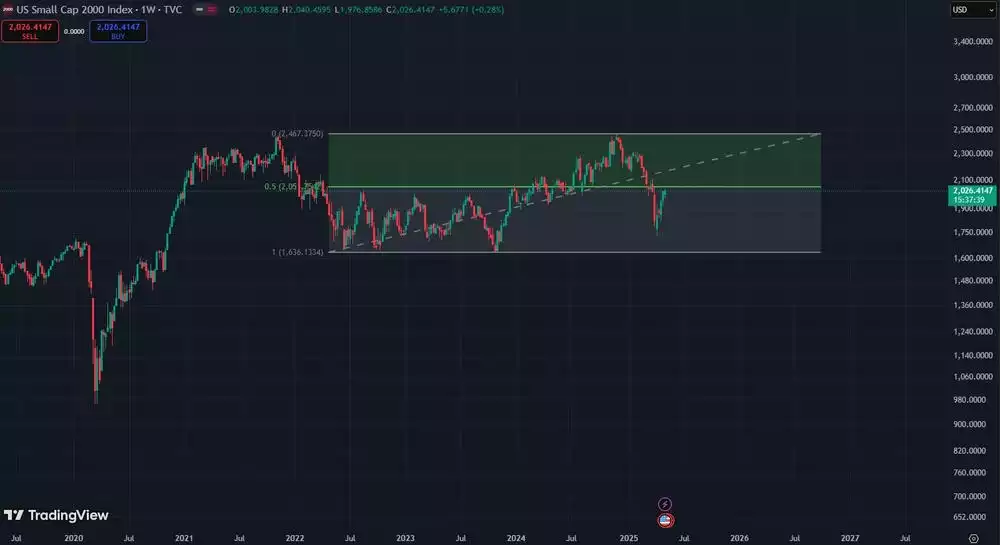
While the DXY has yet to fully break down, and the SP500 has yet to break all-time highs, we can see that the R2K is currently hesitant to reclaim its own macro 50% level. Once we see consecutive weekly closes above this level, we can conclude that risk appetite in financial markets is returning.
With an expected peak between 2024 and 2028, we are currently on the lookout for the final phase of the 18.6-year land cycle, resulting in an increase in leverage and complacency, while risk markets blow off, before a sudden and unexpected financial collapse, taking years to recover from.
The sell off from the Trump tariffs created panic across all markets, however a recovery from this panic with new all-time high prices, would be a perfect catalyst to create the broad-based complacency - with a sentiment of “if the tariffs didn’t end this bull run, nothing will” - with many participants likely getting lost in the sauce of “winning” too much.
Anecdotally - TV personality Jim Cramer recently came out to say “no recession in 2025,” - being notorious for proclaiming the opposite of what eventuates in financial markets, Jim Cramer helps ascertain mainstream sentiment.
A sentiment of “no recession” is exactly the type of complacency one would expect at this phase of the 18.6-year cycle. Combine this with a blow-off rally in risk markets - within the timing window for a peak - and we have all the makings of the final peak of the macrocycle.
While picking the exact top is impossible - averaging into safe haven assets over this final phase allows the prudent investor to take a long term view - helping them navigate both this final liquidity driven phase (where gold and silver benefit being hard assets) and the turbulent phase which follows (with gold benefiting as a flight to safety asset - and silver benefiting from speculation entering the precious metals market).
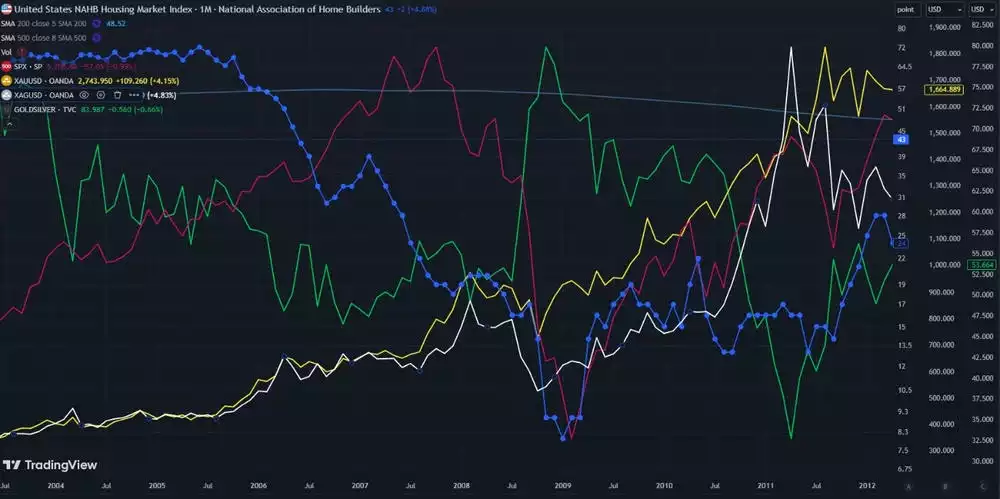
After the collapse phase, silver tends to outperform gold, with the gold-to-silver ratio falling off. This is a result of speculation entering the precious metals markets, amid gold and silver continuing to put in consistent capital gains, while most other markets struggle. Silver, with its smaller market cap, is greatly affected by this speculation.
Below we can see that after the peak of the previous 18.6-year land cycle - the 2008 GFC - land (blue) and S&P 500 (pink) struggle to recover, while gold (yellow) and silver (white) continue to put in consistent capital gains. Also important to note that while the gold to silver ratio (green) had a final spike into the crash, it significantly fell off after the crash, into the recovery phase, as silver outperformed gold.
Watch the insights video inspired by this article here: https://www.youtube.com/watch?v=BaXFLdOxS6A