Rising Global Liquidity Bolster Markets - The “Everything Bubble”
News
|
Posted 02/07/2025
|
2357
As we embark on the final phase of the land-credit cycle, where most financial assets rise together amid leverage, speculation, and greed — before a broad-based collapse — we can see global liquidity begin to tick up via various mechanisms to support this market rally since the recent panic sell off amid global tariffs.
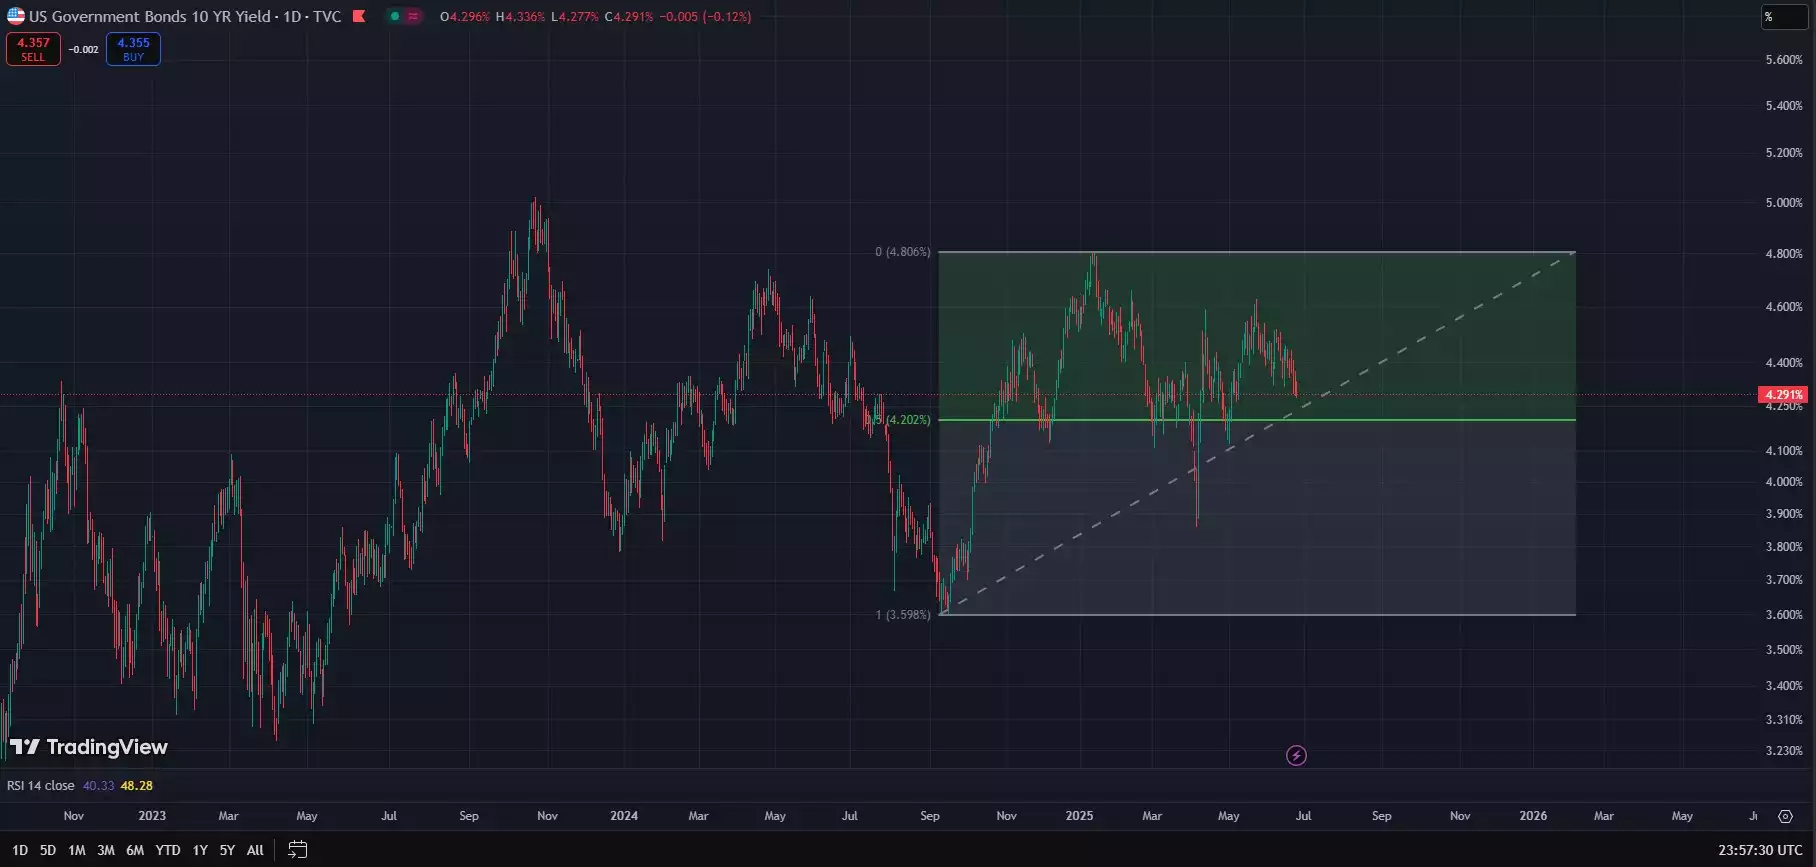
During the global retaliation to the Trump tariffs, we saw the US10Y bond yields spike, significantly dropping bond collateral values. Since then, these yields have notably rolled over, raising the collateral values and global liquidity, thereby supporting most financial markets.

The spike on bond yields also saw bond market volatility shoot up, as measured by the MOVE index, to 140. Higher bond market volatility results in increased risk premiums on bond collateral, meaning the level of debt that can be created using this collateral fall, reducing global liquidity. Low bond market volatility is essential for stable financial markets and sustained liquidity conditions. While the US10Y yield has rolled over, the MOVE index has also reduced significantly, to the low 80s.
While the US10Y may continue to roll over, it's the decline in bond market volatility that has been quietly bolstering financial markets. We note that leading into the GFC, while bond yields remained elevated, bond volatility continued to drop, supporting the final blow-off rally in most markets. As we are currently in a similar stage of the land credit cycle, it would be reasonable to expect a similar dynamic to play out in the bond markets.

A continued downtrend in bond market volatility would continue adding to global liquidity, a roll over in bond yields would be the icing on the cake and contribute significantly to major blow off tops in most markets, before a broad-based financial collapse, amid greed, leverage and complacency.
Meanwhile, the DXY has continued on its own downtrend. While this might see countertrend rallies to the upside, the larger downtrend remains firmly intact, for now.
It is important to note that since January of 2024, the DXY and risk markets haven’t held their usual inverse correlation, but have instead been moving in tandem, leaving many investors scratching their heads.
While August of 2024 saw a sharp correction in risk markets in with the DXY falling off simultaneously, all eyes were on the Japanese Yen amid the Yen carry trade unwinding.
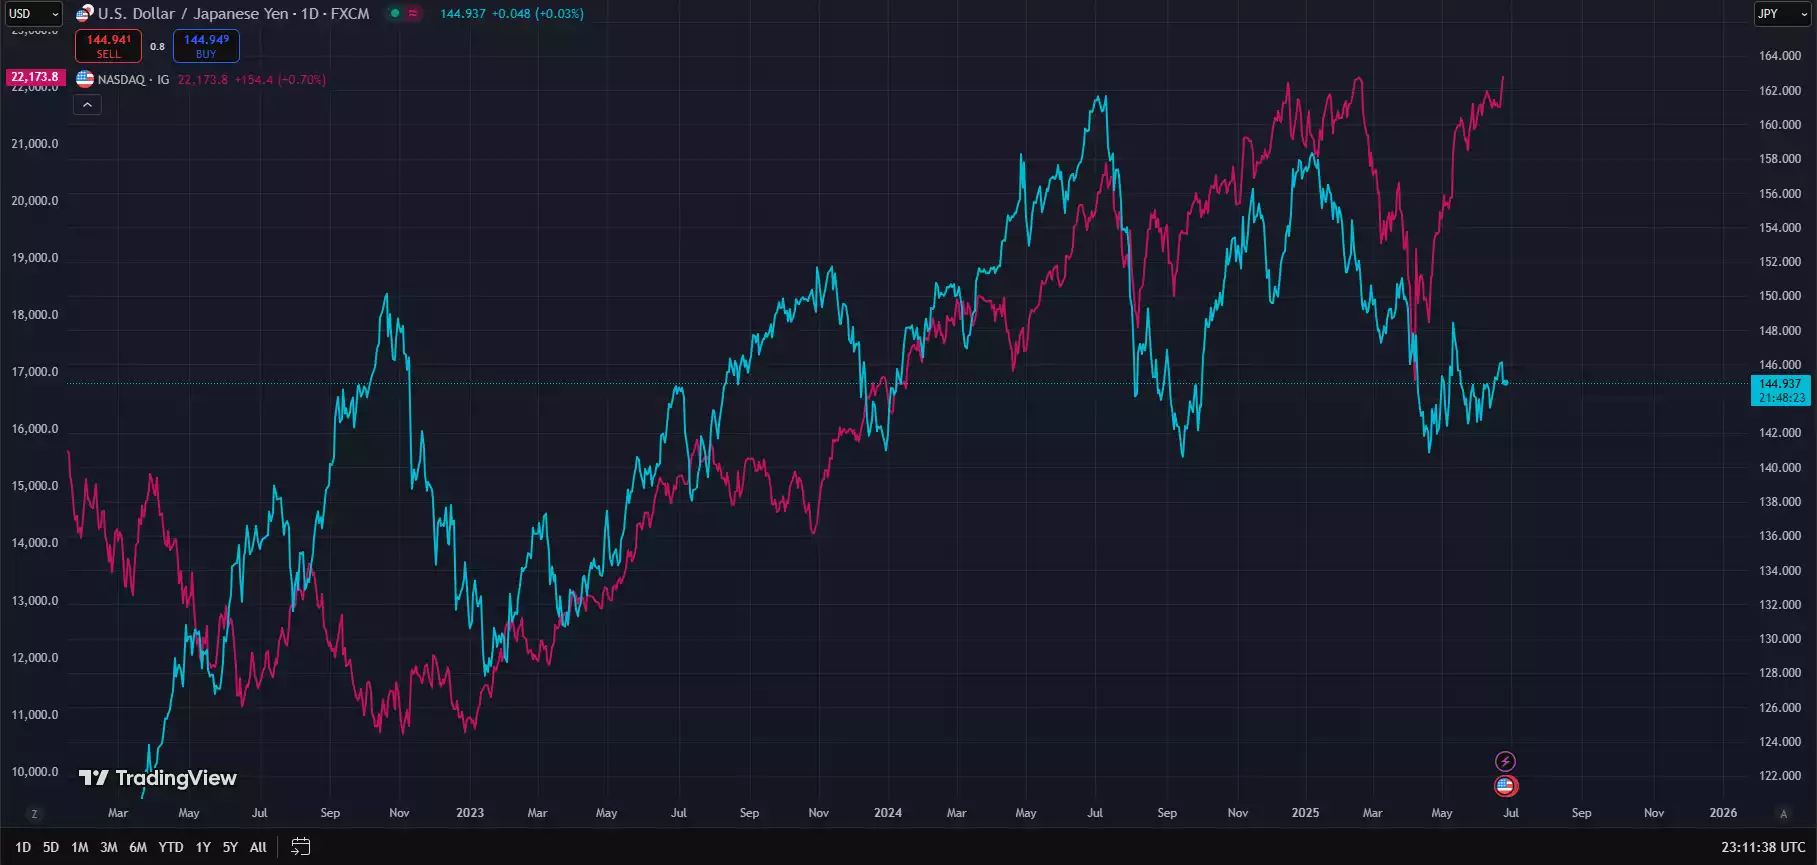
The USD JPY pair can help shine light on why, for over a year, the US dollar relative strength (as shown by the DXY) has been adding net liquidity to markets rather than draining it.
Below, we can see the Nasdaq rally with the USD/JPY pair, showing that the yen carry trade has been a major driver of global liquidity this cycle.

We see that each time the US dollar loses strength against the Japanese Yen, liquidity is drained, while the DXY is falling.
With the Yen composing about 13% of the DXY, this dynamic appears to be a significant factor for the breaking of the DXY's usual inverse correlation to global liquidity and risk appetite.
Tracking the USD JPY pair is more important than ever to track risk markets.
It would not be unusual to see markets rally, even with the DXY rallying, due to the dollar gaining strength against the Yen, bringing the yen carry trade to fruition - flooding the global financial system with cheap yen-denominated debt, which is reinvested in higher-yielding markets.
USD JPY is currently working on breaking out, not yet confirmed. This adds weight to the idea of an upcoming rally in risk markets, even if the DXY rallies.

Outside of the USD, the JPY has been the world's largest funding currency. Even though the Yen makes up 13.6% of the DXY, in an ideal scenario for liquidity, the Yen weakens against the USD while the DXY falls.
With the big picture downtrend for the DXY intact, and land markets in the final phase of the 18.6-year land cycle, where the DXY traditionally has fallen off — with most markets blowing off — this is exactly the scenario we are on the lookout for — to see risk rally. And while most get caught up in leverage and greed, the astute investor uses this final macro rally to transition from land and stocks, into gold and silver, which not only rally in this final uptrend but continue to rally upwards during the recovery phase after the crash, when land and stocks struggle.