Reflections on the Global Financial Crisis - Gold, Silver, Stocks, and Land
News
|
Posted 14/11/2024
|
3156
Over the past 300 years, most Western economies have recorded a recession approximately every 18.6 years (the shortest cycle on record is 17 years, with the longest being 21 years) - which resulted in multiple consecutive quarters of declining land and stock markets. The most recent example was the Global Financial Crisis - where stock markets began declining after October 2007, about 17 years ago.
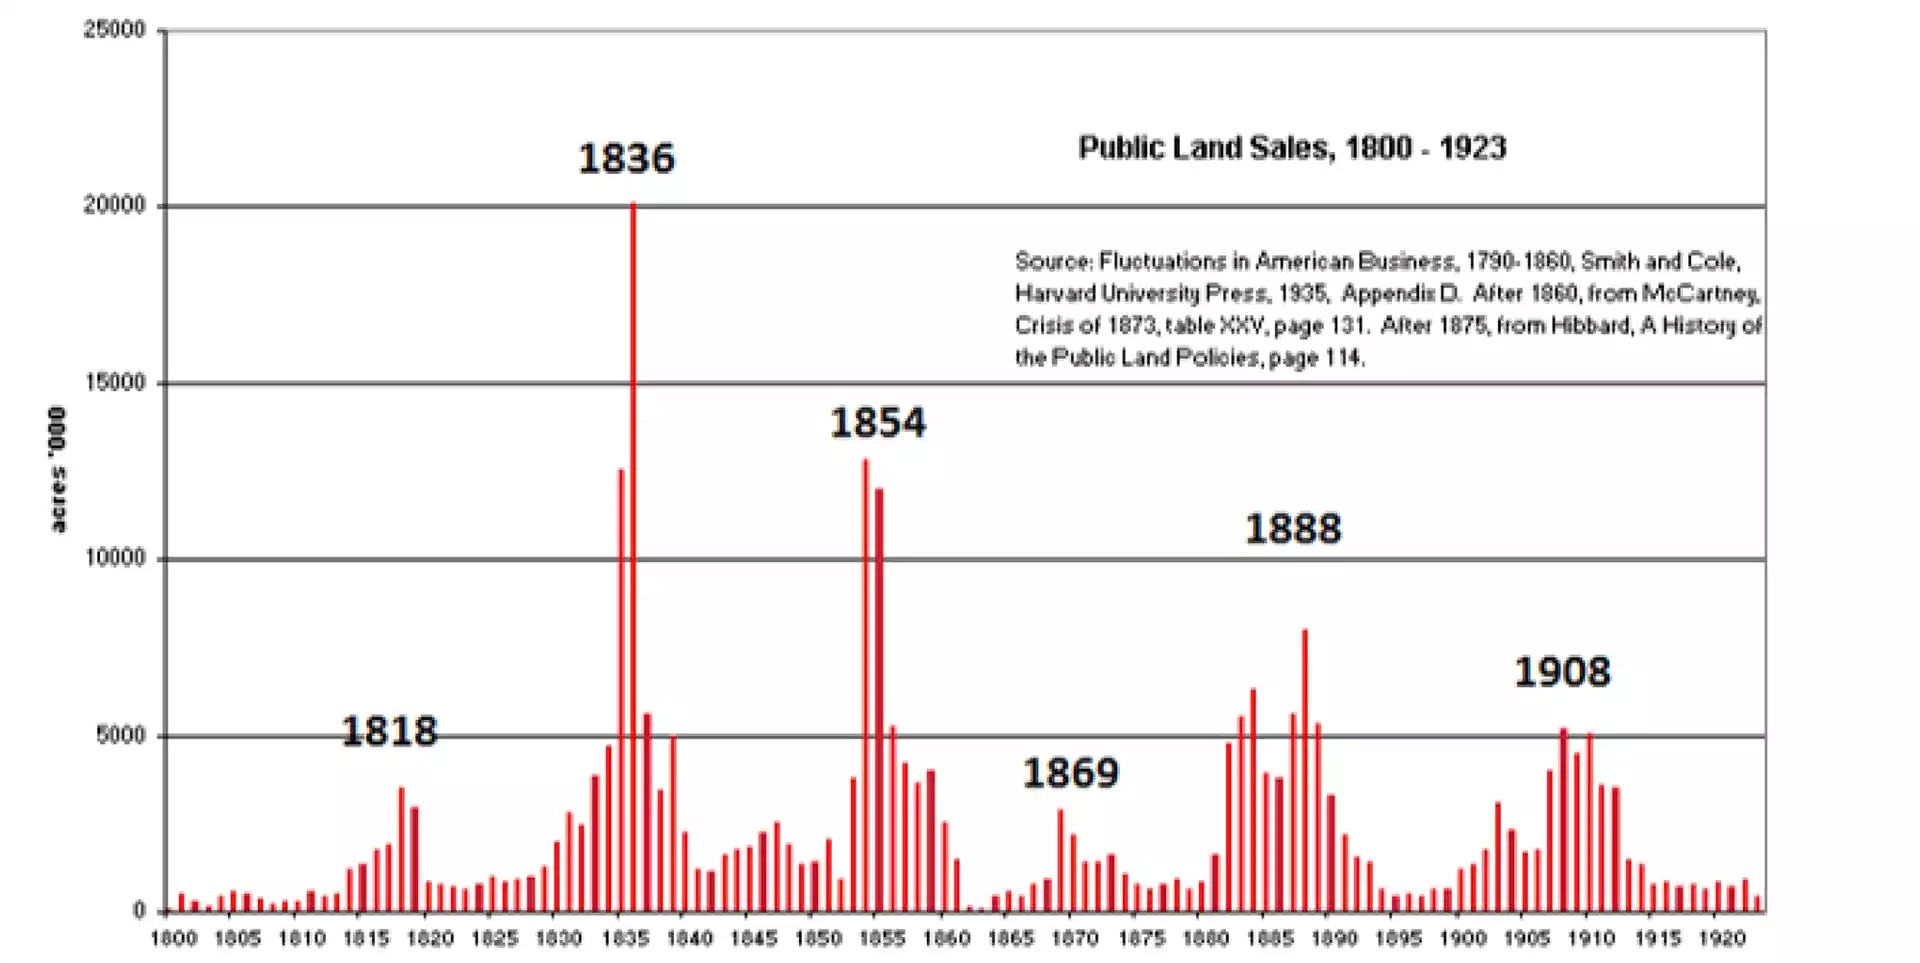
Notice the approximate 18 years between each land cycle boom – uncanny.
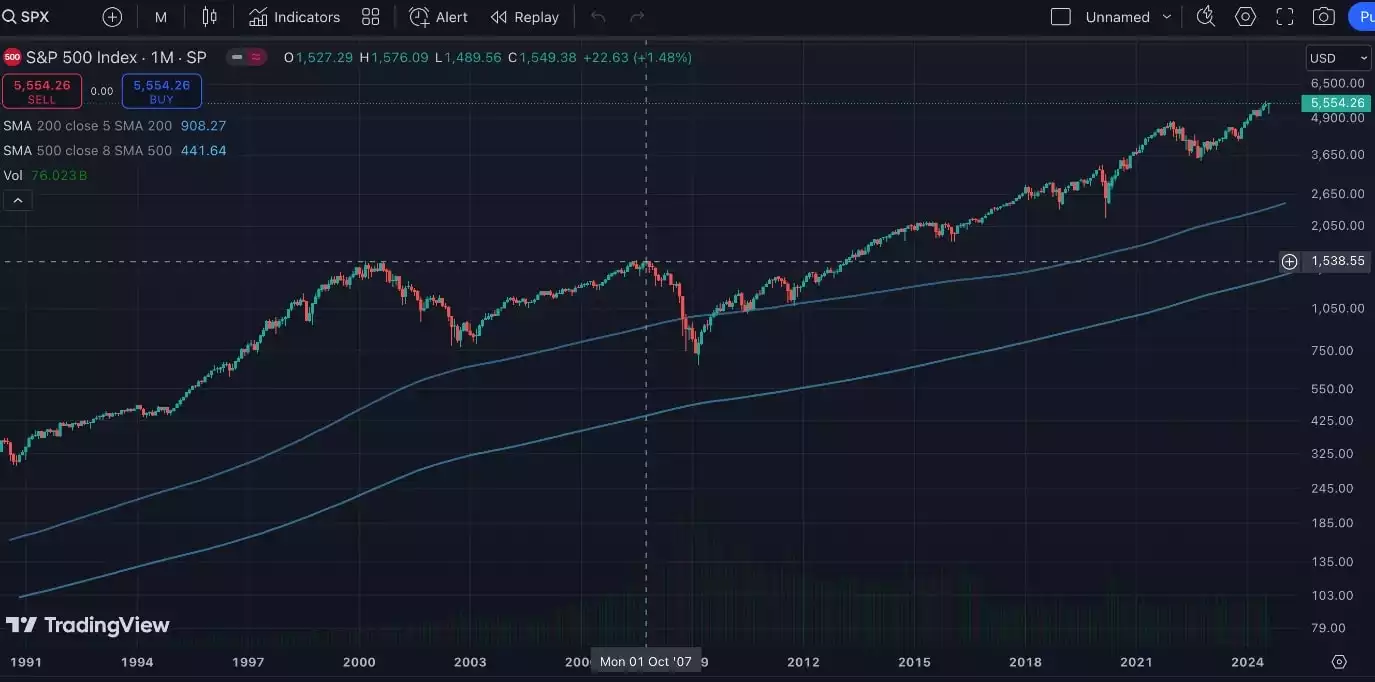
The S&P 500 peaked in October 2007 before the Global Financial Crisis, about 17 years ago.
Based on the previous 300 years of land data, we could expect stock markets like the S&P to put in a macro peak somewhere between 2024 and 2028, with an average expectation of early 2026 (18.6 years from October 2007). Following this, it would be reasonable to expect a broad-based recession - defined by systemic financial collapses, declining land values and struggling stock markets in Western economies.
It is noteworthy, that with the completion of this current 18.6-year land cycle - we are also simultaneously completing the fourth 20-year cycle (called the fourth “turning”) - of a macro 80-year socioeconomic cycle - so the upcoming recession could be at a scale larger than the Global Financial Crisis – the previous fourth turning was the great depression in the 1930s.
So, what can we expect from stock markets, land markets and precious metals like gold and silver during this time? Our most recent reference point of the 2008 GFC, could help shed some light on this - arming us to make decisions about asset allocation and preservation as we navigate the current ongoing cycle.
Stock markets
The chart below shows that the S&P 500 lost 57% of its value over 16 months, starting in October 2007. It then took 6 years, until 2013 to regain this value.
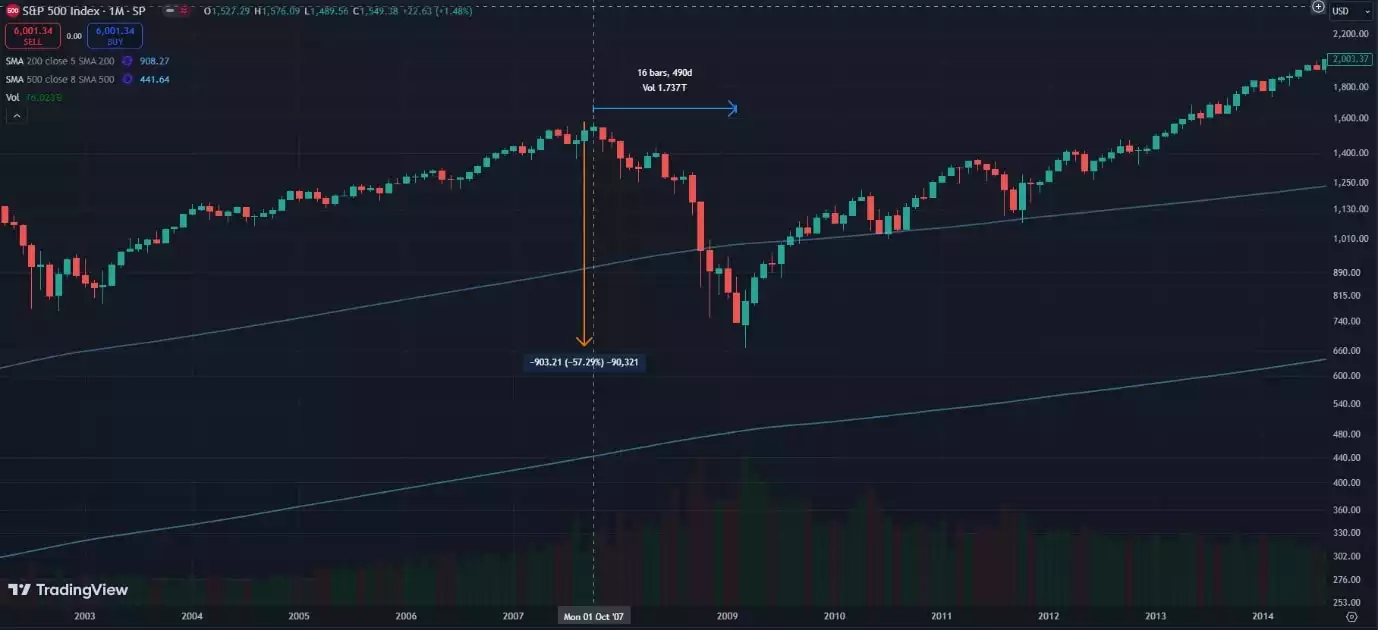
Many people who had been working for decades, building up their retirement funds - that were held in the shares - watched these funds lose over 50% of their value leading into their retirement. While postponing retirement for 5 years seems like a straightforward solution in hindsight, the uncertainty and emotional toll of wondering how long it would take to build back up is incalculable.
Land markets
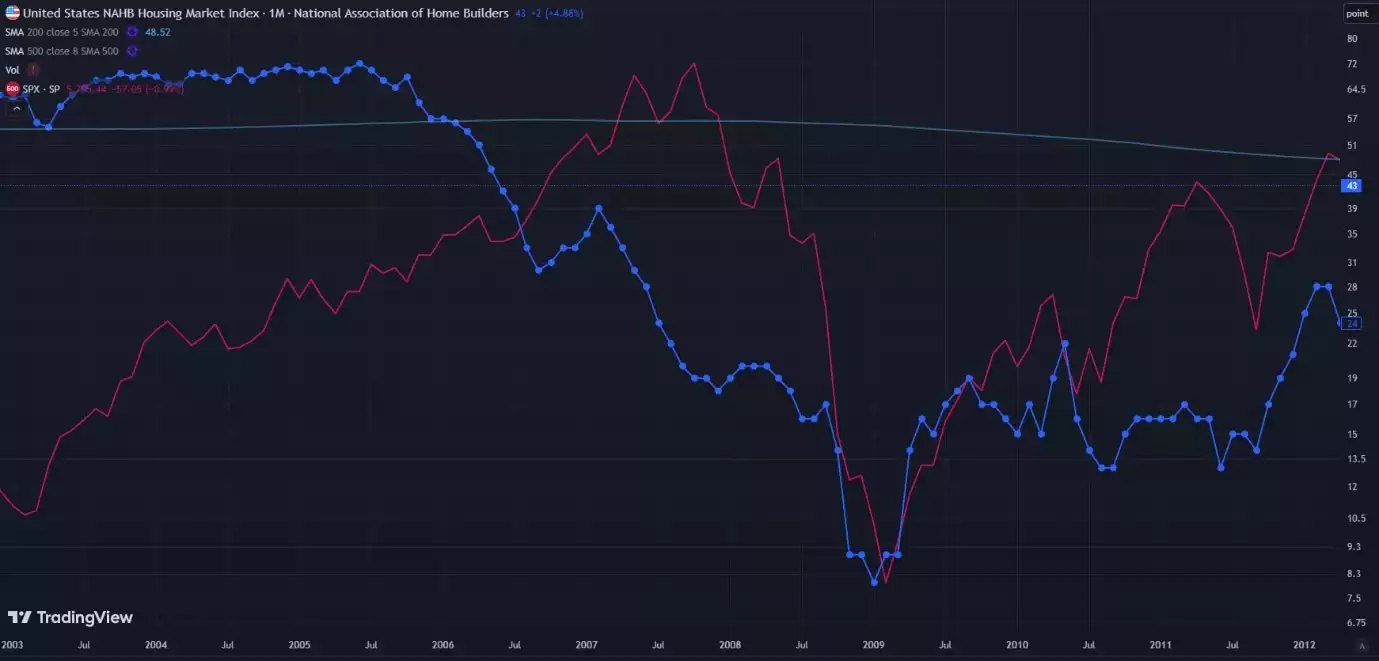
The chart below shows that while land markets (blue) in the US started falling off earlier, land and stocks (pink) found a bottom at the same time. Important to note that different markets peak at different times in this macro cycle.
Gold
How did gold perform during this seemingly uncertain time?
The chart below paints a compelling image of gold’s significant outperformance while other markets struggled.
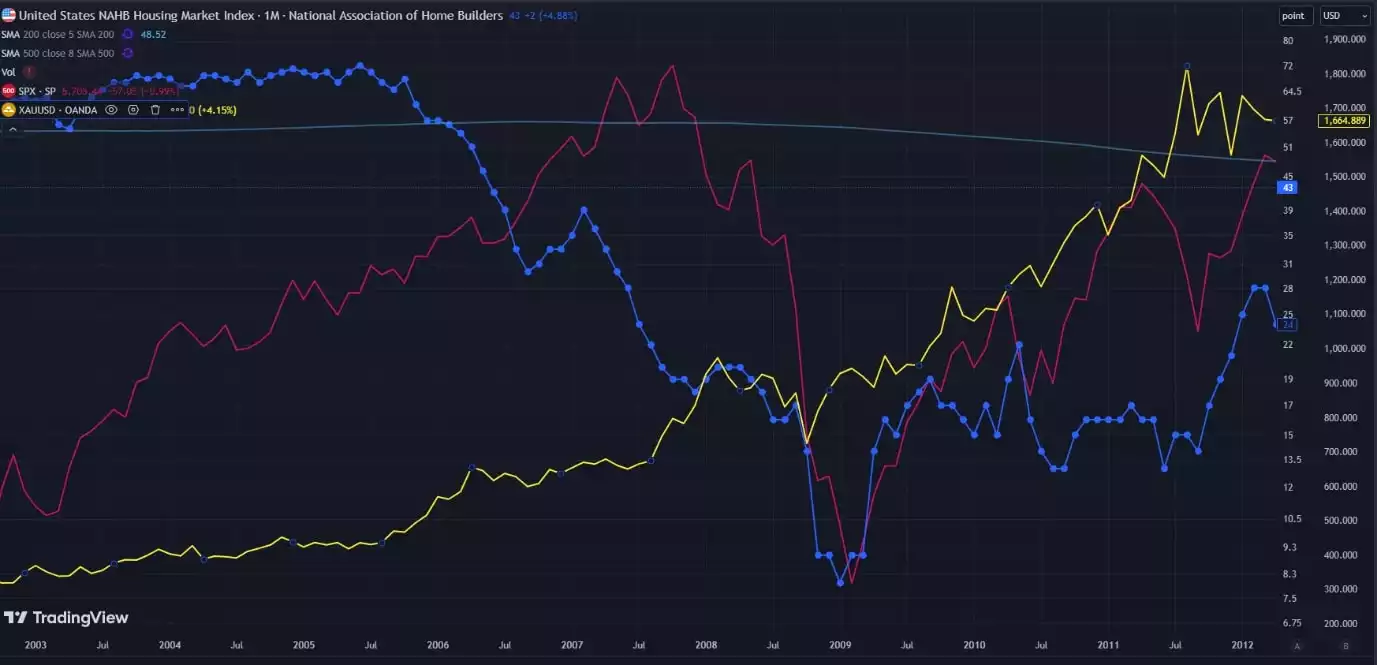
We see that while land and stocks decline, with stocks losing all their value gained over the previous 4 years - Gold’s ongoing price increase only has a minor dip and then continues upwards with formidable strength. Gold continues putting in new highs after new highs, while most other markets spend years recovering from a collapse.
This shows that while gold benefits from the final uptrend of the 18.6-year macrocycle, it continues to benefit during the recession phase that follows. This is because, gold is a global safe haven asset, and it also benefits from increased liquidity - This places it in the unique position to gain value when liquidity increases in the euphoric phase (along with stocks) - and continue to gain value during the crash (while stocks and land take a beating).
While gold, land and stocks move up in tandem for the euphoria phase with increasing liquidity - eventually all the overleveraging and speculation in the system tends to cause a systemic crash - decimating the stock market - at which point investors seek shelter from the storm in safe-haven assets. So, while gold and silver experience some short-term volatility during the crash phase - their long-term uptrends tend to remain intact - and they continue gaining value during and after the crash phase.
We are currently on the lookout for something similar to the GFC playout, but at an even greater scale, we see precious metals emerge as the investment of choice during this macro phase. How did silver perform during this time? It outperformed gold.
Silver
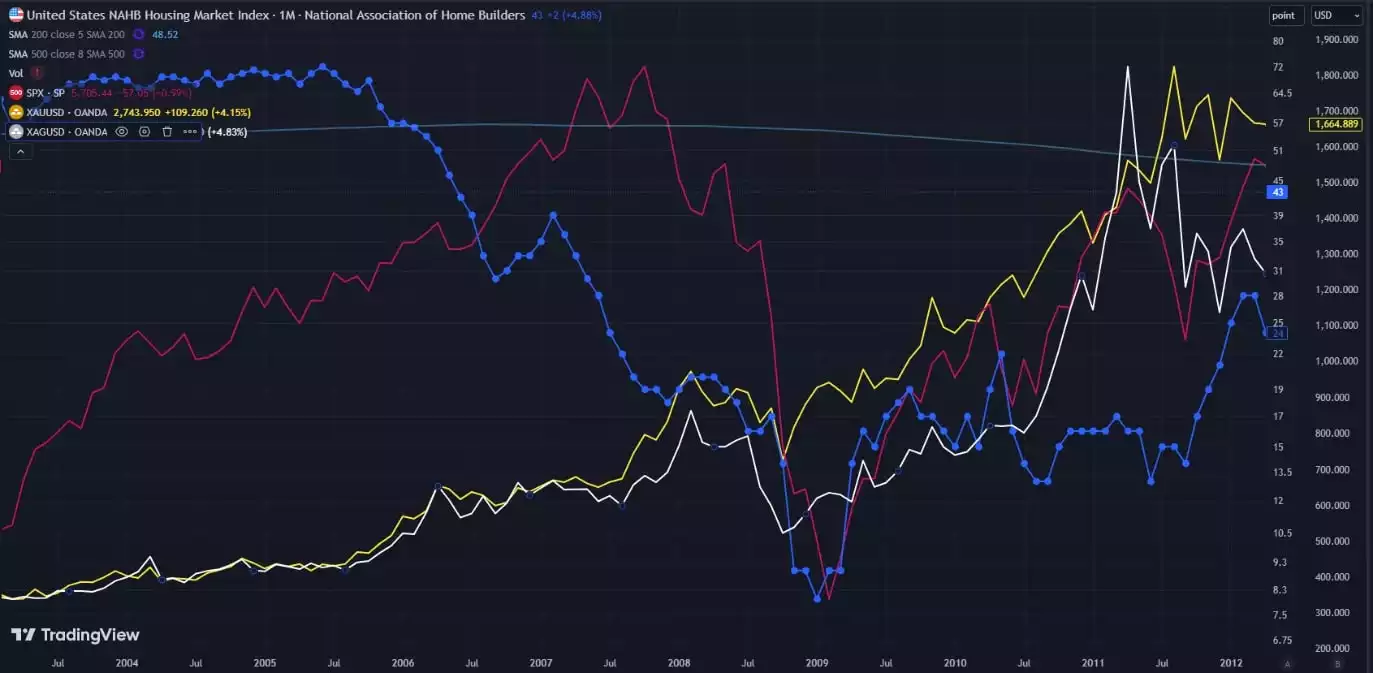
Gold and silver during the GFC allowed investors to capture significant capital growth while simultaneously securing a hedge against systemic collapses - with silver outperforming even gold during this time.
The GSR can shed some more light on silver's outperformance of gold during this phase. The Gold to Silver ratio tells us how many ounces of Silver give us one ounce of Gold. When this ratio is high, silver is objectively undervalued when priced in gold. If silver is bought when the ratio is high and traded for gold when the ratio is lower, investors have done well to increase their gold holdings.
GSR
We can see some volatility in the gold-to-silver ratio during the last financial crisis.
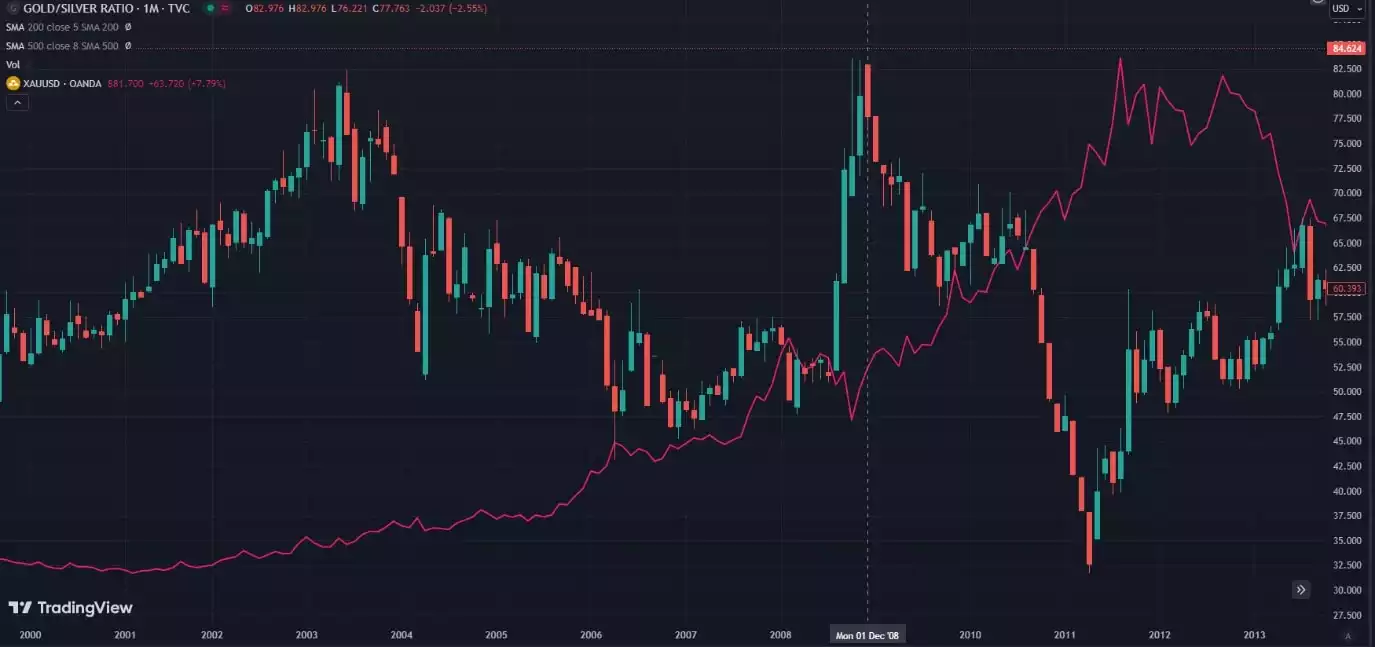
For 4 months, between August to December 2008, during the height of the GFC, when investors were seeking shelter from the storm, the GSR shot up to 82. Following the crisis the GSR fell to 35 - with silver taking centre stage, leading the way and outperforming gold significantly. The GSR (currently at 84) being used to track swaps between gold and silver will become increasingly relevant in the upcoming phase of the 18.6-year economic cycle.
Why does silver outperform after the crisis hits?
Leading into the crisis, with rising liquidity, both gold and silver increased in value. During a time of crisis, investors seek safe-haven assets to get shelter from the storm. Assets not connected to any government or financial institution - with a proven track record over centuries (gold and silver have a track record over millennia). This causes a significant price increase in both gold and silver - leading into the crisis – with gold outperforming silver, initially as the AAA haven asset.
However, after the crisis - as gold and silver have been increasing in value while most other markets are collapsing – the average retail investors start noticing the precious metals bull run - which starts to drive retail and institutional speculation. With a smaller market capitalisation and lower liquidity, this speculation causes serious price increases in silver - causing silver to lead the way, subsequently outperforming gold - this causes the gold-to-silver ratio to reduce.
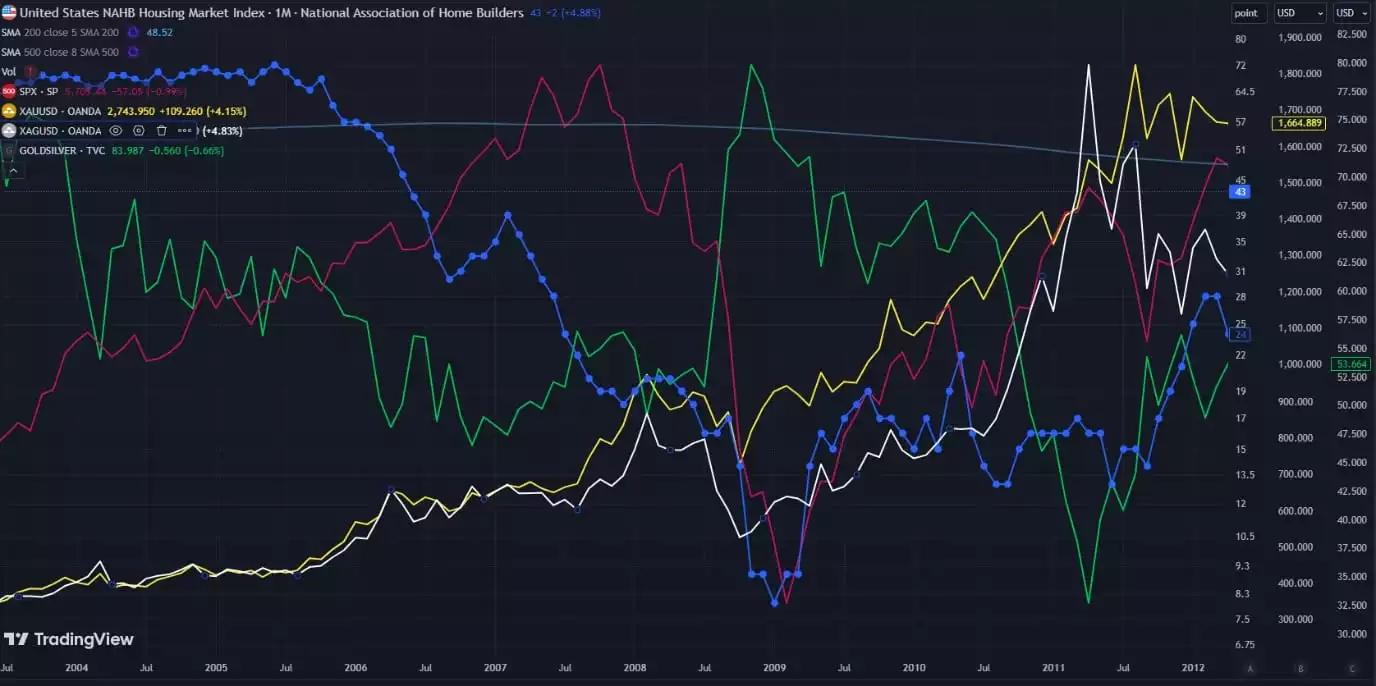
With the silver price outperforming, we can see the GSR drop off - after the initial spike that occurred during the crisis phase.
The fourth 20-year socioeconomic cycle, silver and the GSR
The “Four Turnings” is a thesis formulated by historians Neil Howe and William Strauss in 1997, suggesting that society moves in 80-year macrocycles - made up of 4 sub-cycles, each lasting about 20 years - called “turnings”. Every turning has its own generational archetype, specific role to play, and predictable result. The transition from one turning to another is catalysed by crisis. The transition from one 80-year cycle to the next is catalysed by an even bigger (once in a century) crisis.
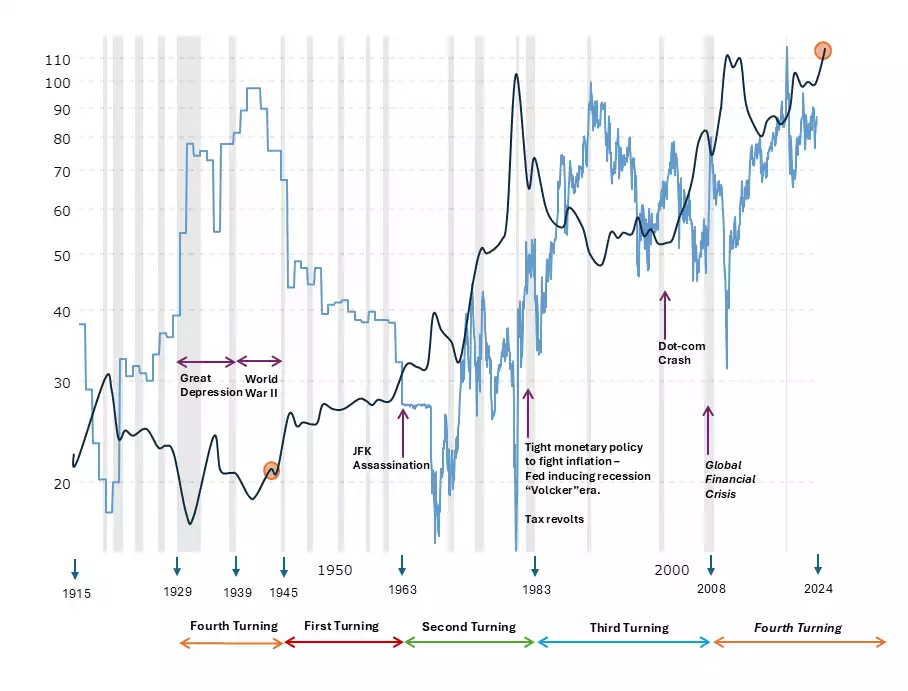
We can see on the chart above - that the Gold to Silver Ratio (light blue) drops off as we transition from one turning to the next - however the real dramatic drop off of the GSR happens - from the fourth turning of one 80-year cycle to the first turning of the next 80-year cycle. During this time the silver price (dark blue) embarked on a multi-decade uptrend, continuing into the second turning.
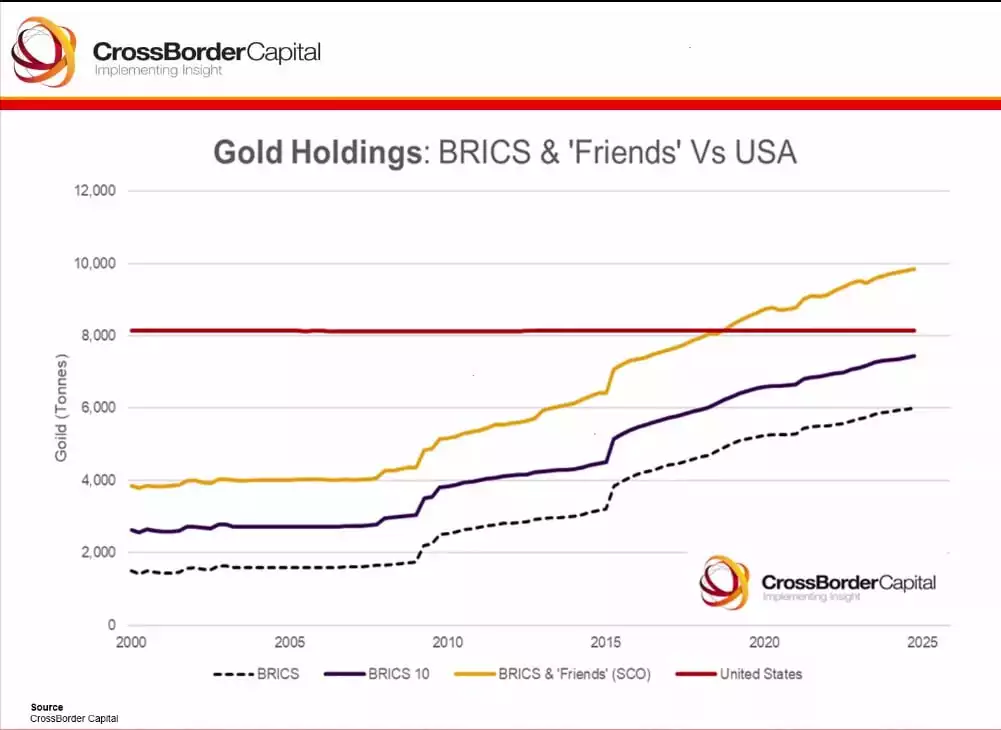
Would it be reasonable to expect something similar to reoccur over the upcoming cycle? With greater industrial use cases than ever before, a global shortage of over a billion ounces of silver from the past 5 years and nations stockpiling both gold and silver it is certainly a possibility.
Summary
With the culmination of an 18.6-year land cycle and an 80-year socio-economic cycle, we can lean on the historical data, to help forecast the upcoming decade.
As we foresee an upcoming land cycle recession, while simultaneously transitioning from one 80-year cycle to the next - amid societal changes, chaos and financial collapses – we could expect gold and silver to continue onto generational bull runs – while also expecting the gold-to-silver ratio to drop off later this decade - at a scale potentially unseen for 100 years.