Record High Vals & Yield Curve Screaming Market Top
News
|
Posted 05/02/2020
|
17768
Crescat Capital, as always, have a way of cutting through the noise via clear charts that tell a thousand words. Lets have a look at a few of the latest from their Quarterly Investor Letter.
First let’s revisit the crazily high valuations at present on the so called cleanest dirty shirt, the S&P500. EV, courtesy of Investopedia is “a measure of a company's total value, often used as a more comprehensive alternative to equity market capitalization. EV includes in its calculation the market capitalization of a company but also short-term and long-term debt as well as any cash on the company's balance sheet.” Their opening paragraphs give a clear warning:
“The bear case for US stocks has never been stronger. The set-up looks like January of 2018 when we were similarly bearish yet the market kept screaming higher. Our views were strongly vindicated in February and over the course of that year. The speculative mania of 2019 was wholly unwarranted, not supported by macro indicators, equity fundamentals, or technicals. There is a business cycle after all, and it is poised turn down as it always does. It’s timely for investors to be aware of the gravity of the situation today.
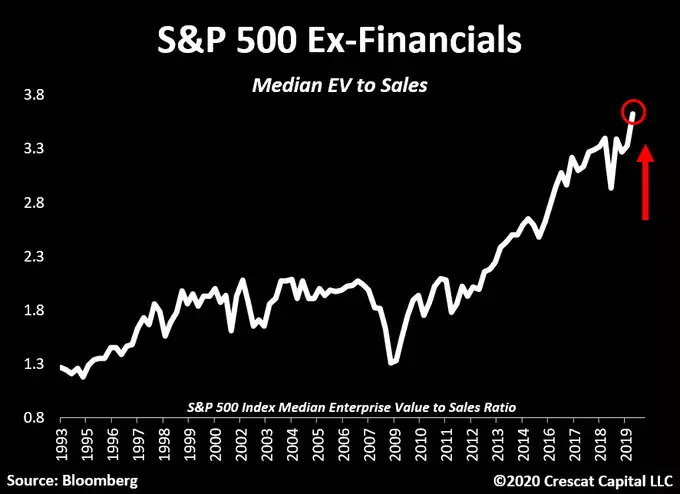
We certainly did not predict the Coronavirus, but it may prove to be the catalyst to tip this market that is trading at truly historic valuation levels after a record long US economic expansion. Median EV to sales for the S&P 500, based on our work recently reached an insane, euphoric level of 3.6 times, two times more than the tech bubble peak.

Their reason for choosing Median EV to Sales is explained:
“The problem is that P/E, even Shiller’s cyclically adjusted P/E ratio (CAPE), is a potential value-trap measure in the current economy because of three issues:
- Profit margins are unsustainably high today, not only within this business cycle but compared to other business cycles making P/E ratios understated; [addressed by using sales]
- The P/E ratio completely ignores debt in its valuation, not a good idea at a time when corporations have record leverage; and [addressed by using EV]
- The most common measures of total market P/E use the mean rather than median company valuation which understates the average company’s multiple today by putting more weight on bigger, more profitable companies – the median better captures the valuation of the breadth of the market. [addressed by using median]
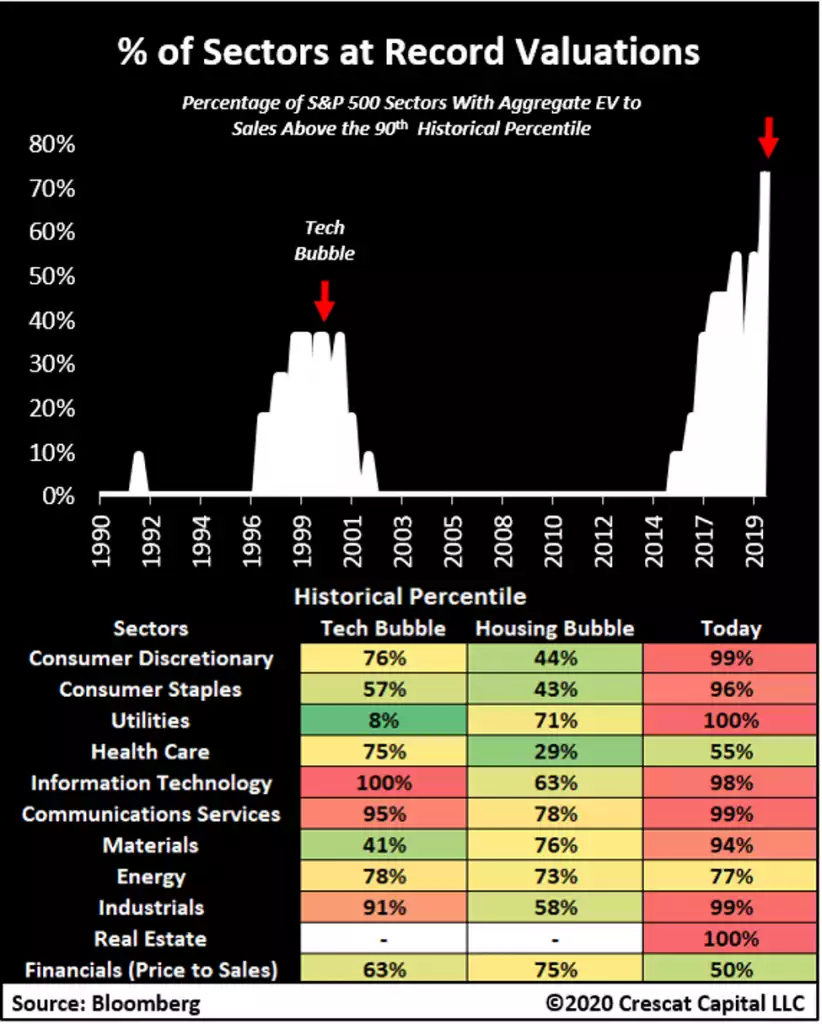
The breadth of this ‘everything bubble’ is also captured in the following chart that breaks it down by sector:

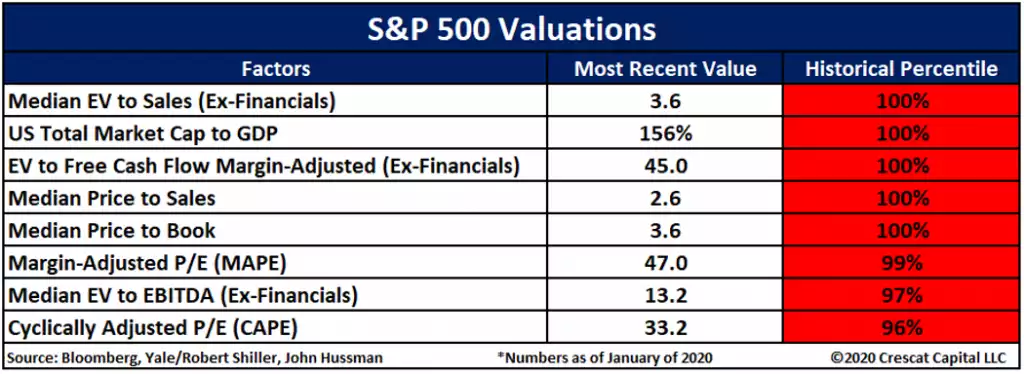
But if you’re not convinced Median Ev to Sales is the right valuation metric then check out the rest as they are even worse:

Crescat have their own macro model that “includes four of the valuation measures above plus twelve business cycle indicators such as employment and consumer confidence (contrarian indicators), yield curve inversions (historically infallible), and other proprietary factors”. It is now showing a bear market is imminent:

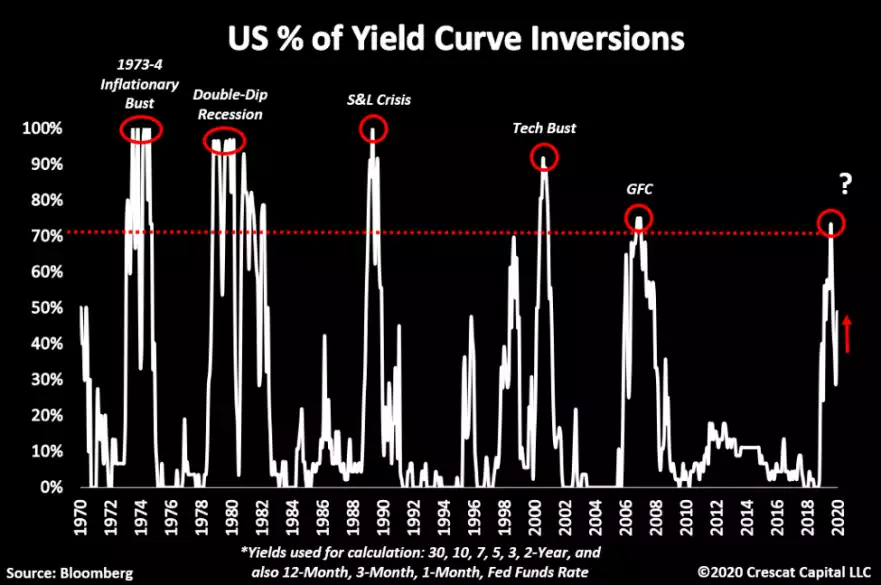
Finally, a lot of the US Treasury yield curve inversion talk has seemingly disappeared. If you read our articles at the time you will know that the inversion of the curve is a leading indicator and one that can take a year or more to see the historically inevitable recession afterward as it starts to climb again as the Fed unleashes easy monetary policy. Since the model hit 70% the Fed has cut rates 3 times and injected $400 billion into the market via the Repo market (stressing this is not QE) but with the Repo market liquidity crisis still unresolved.
“Keep in mind that Crescat’s most reliable recession harbinger already flashed a warning signal several months ago when the percentage of inversions in the Treasury yield curve surged above 70%. This indicator is Tavi Costa’s very own invention. We believe it is more robust than common yield curve inversion models. While it is a back-tested model, and it could be “different this time”, it has perfect history of predicting prior economic downturns since 1970.”
