Preview - In Gold We Trust report 2023 – A MUST READ
News
|
Posted 23/03/2023
|
13322
Easily the most anticipated gold analysis annual in the world, today we present a series of preview charts from the main event to be released at the end of May. Grab a coffee, put on your best ‘thinking hat’ and let’s look at the world in charts…
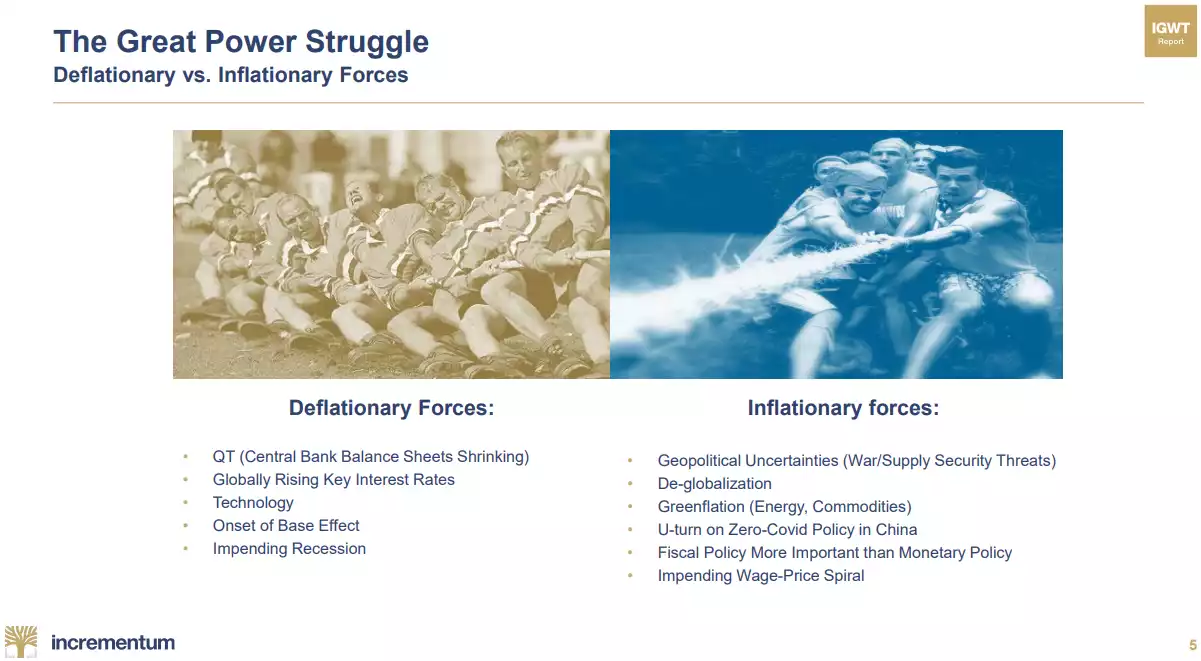
As evidenced last night with the Fed raising rates and continuing with QT BUT removing hawkish talk from the commentary, the struggle continues as summarised below:
For year IGWT has talked of this near 3 decade long Era of Great Moderation. 3 decades of relatively stable and low inflation.
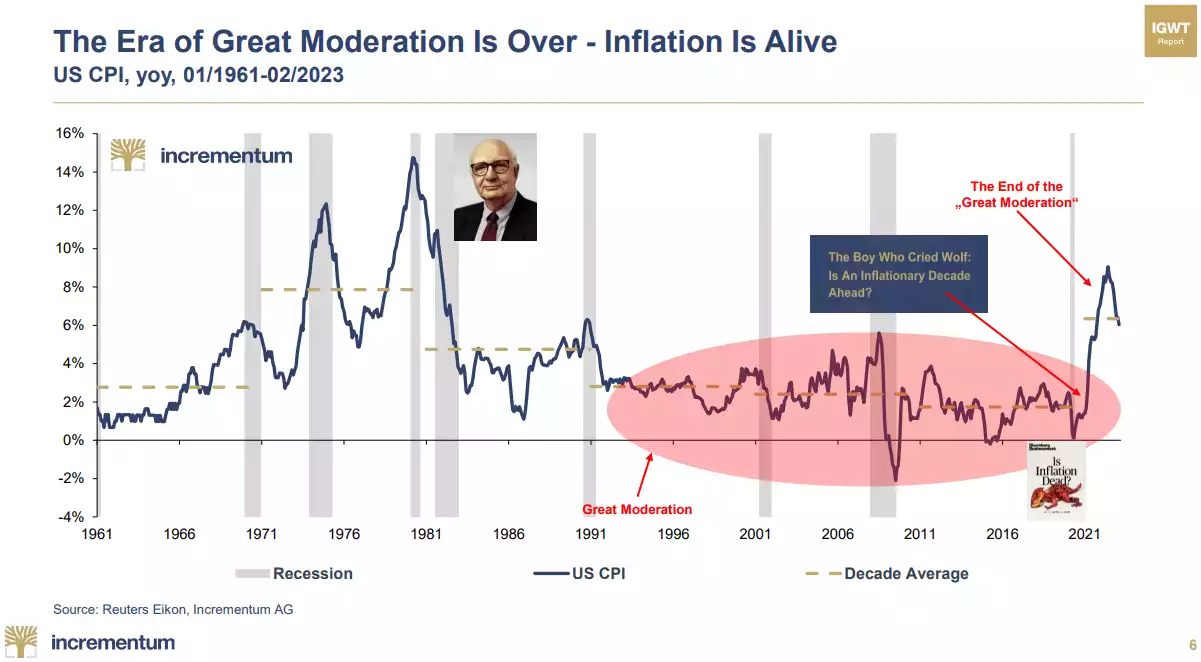
And with all the talk of inflation quickly coming back, history, and the very highly likely scenario of the Fed having to pause or cut before inflation is dealt with means it will likely take off again.. During the stagflationary 1970s, it took more than a decade to bring down inflation…

And as a reminder of the inevitable outcome of tightening…
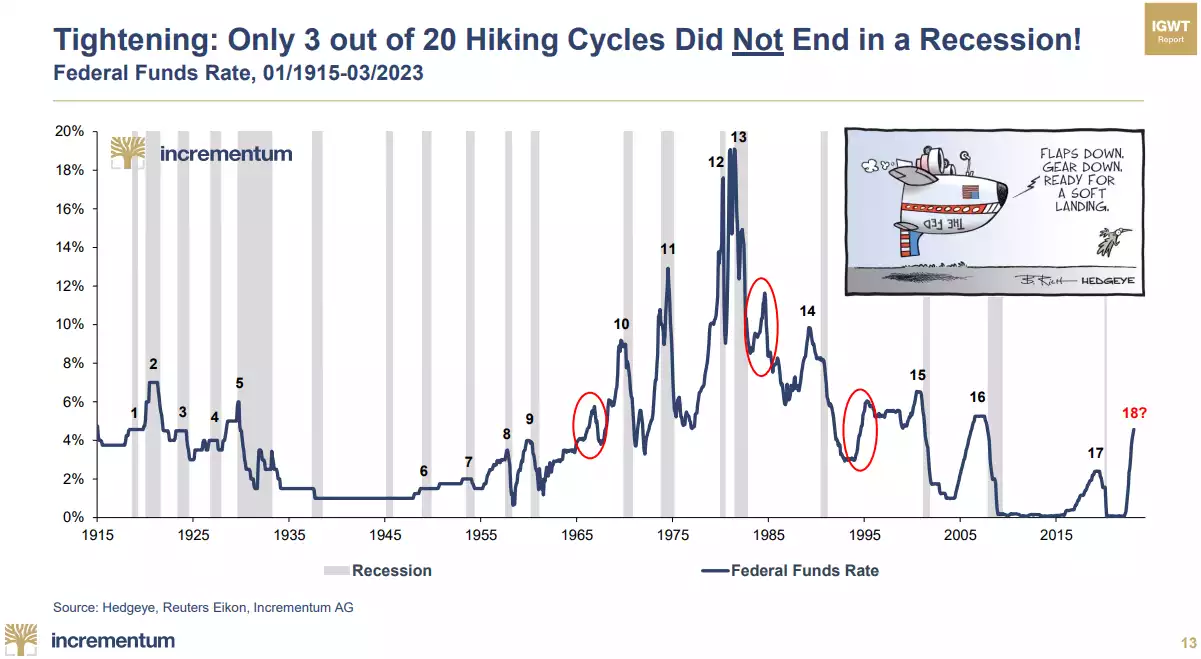
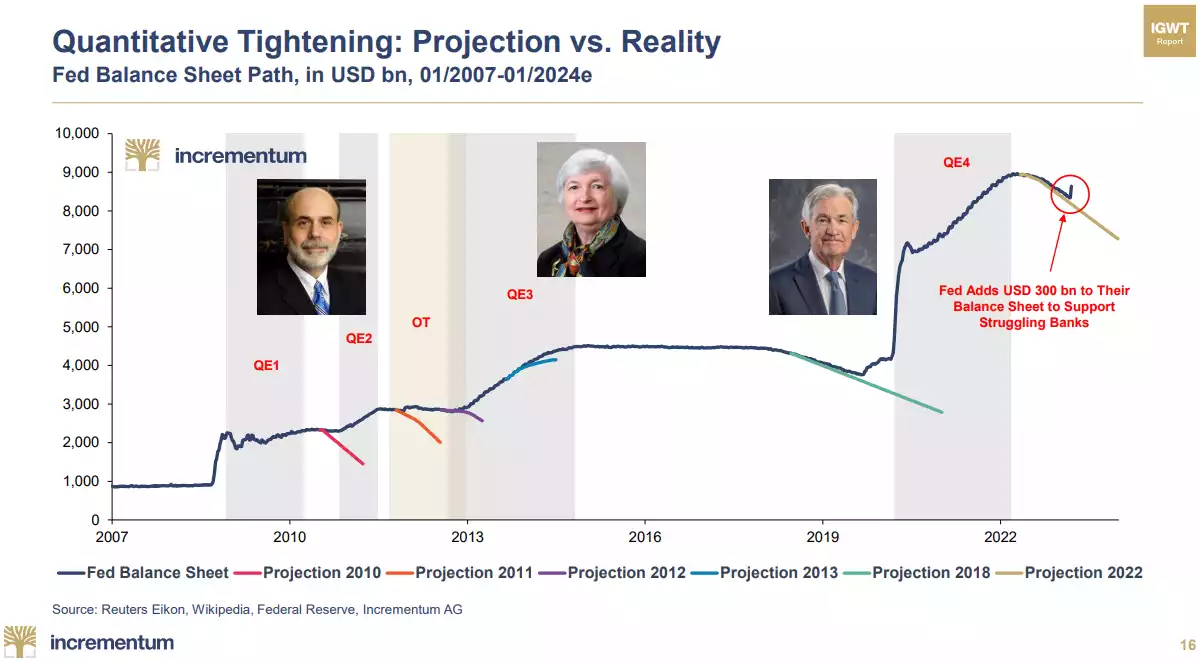
And when we say tightening, we mean TIGHTENING…

This week we wrote an article titled UBS CREDIT SUISSE ”NOT A BAILOUT” DEAL: FOLLOW THE MONEY, NOT THEIR WORDS. Last night the Fed said it would continue QT (reducing their balance sheet). Its not the first time they’ve said one thing and done another…
Mortgage rates in the US are up 100%, both manufacturing and services PMI are plummeting and a host of other economic metrics are screaming recession dead ahead.

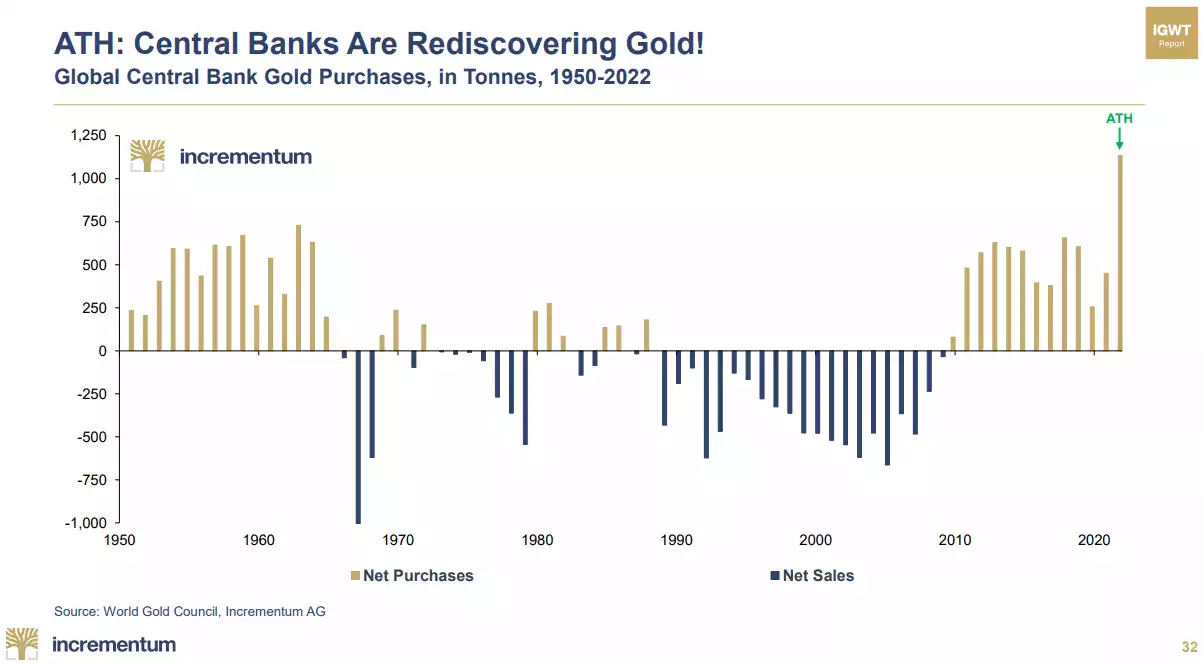
And again in the context of central banks saying one thing and doing another… They are buying gold hand over fist…
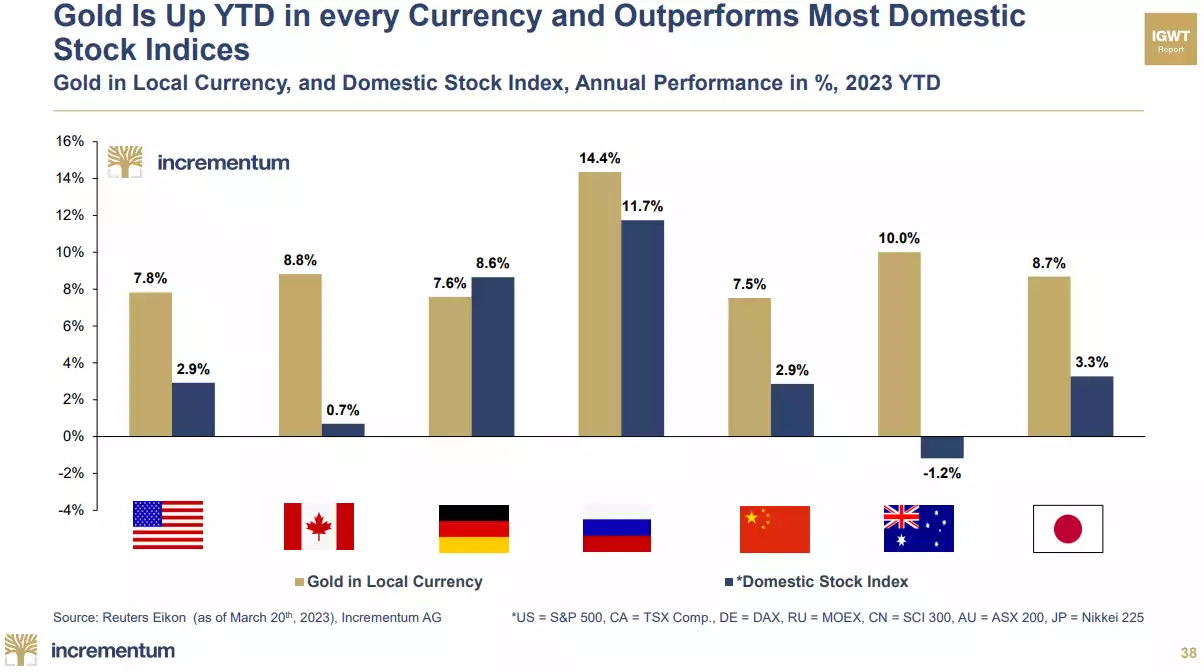
Despite the head winds of higher rates and a higher USD, gold is performing admirably.
And as we head toward recession and the inevitable equities correction that comes with that, it is worth revisiting how gold performs relatively…

And as for silver

Remembering we are currently at a Gold:Silver Ratio of around 86 compared to a long term mean of around 30!

The future looks almost certain in terms of the need for the US to go into more and more debt to fund its ponzi scheme economy. The chart below is remarkable in that it does not factor in a recession, is the US government’s very own projection showing deeper and deeper deficits and doesn’t include unfunded liability which are very real and blow this sky high. There simply is no orderly exit…

We’ve mentioned the magnificent cup & handle technical formation numerous times and IGWT concur, it could be explosive to the upside if this break in the channel holds…

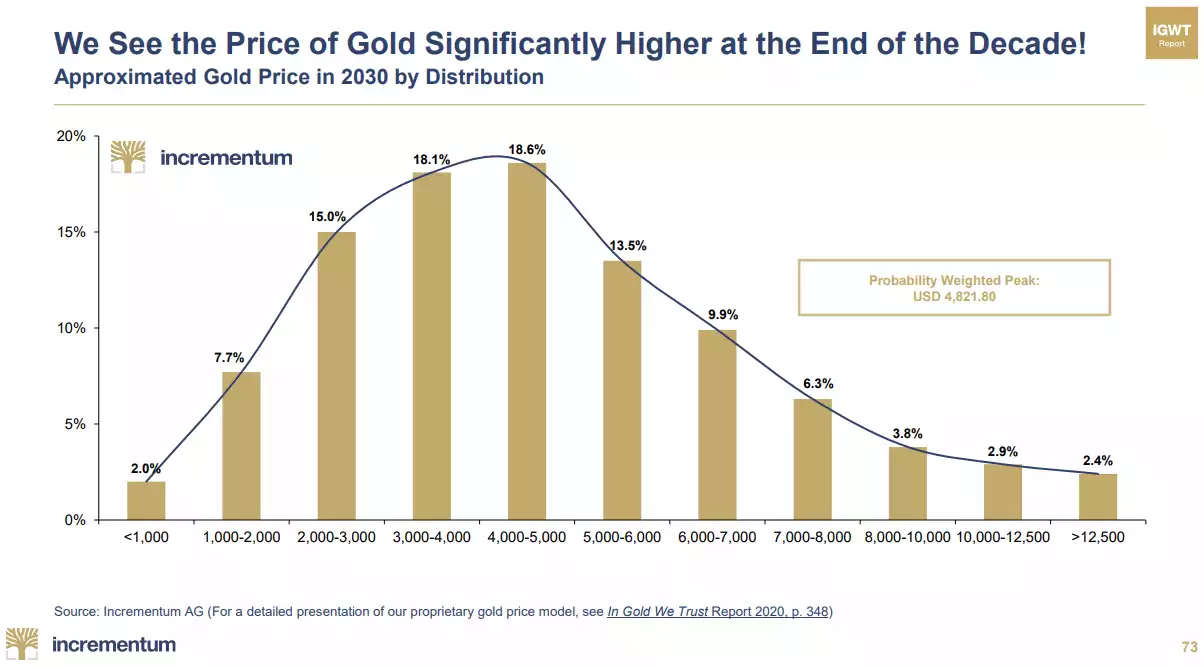
And finally, their ‘scientific’ crystal ball looks like this for gold by the end of the century…