Pivot Too Late? Ask "Dr Copper"
News
|
Posted 18/05/2023
|
4592
According to TransUnion, US credit card debt has jumped 20% in the first quarter of 2023 compared to 2022. Balances on personal loans also rocketed 26% higher compared to the first quarter of 2022. In an environment of higher interest rates and slower growth, this can indicate that consumers are using their credit cards for necessities and not leisure spending. There is currently a heavy focus by macro analysts on liquidity, but this illustrates that liquidity is not very helpful if those who need it do not have adequate access to it.

Surely there is an easy fix to this problem, right? Analysts are eagerly debating when the Fed pivot will come and stimulate the next bull market. At the first sign of trouble, the Fed (and other central banks) can simply loosen their hawkish stance to accommodate the risk markets. What could be the problem?

Economic adjustments take time to have an impact on individuals. We have potentially not yet seen the full effect of the increase in money supply from the last several years on the cost of goods. Increased financial stress on businesses and individuals cannot be immediately rendered non-existent from a slight interest rate adjustment either. Businesses shrinking, thousands of employees being made redundant, and money already forfeited to large credit card debt payments are not immediately remedied by this. Essentially what happens is the consolidation of assets, small businesses, and banks into larger entities that were able to better weather a harsher interest rate environment.

There is also something called "diminishing returns". This makes the stimulus of the GFC (featured controversially above) seem small by today's standards. Creation of money can stimulate but it does not necessarily create value. A classic example of this is if a potato farmer gets a million dollars, he might be able to buy more surrounding land, buy a better tractor, or hire more workers, then he could grow more potatoes. But once he has a better tractor, has all the available farmland, and hired enough workers, sprinkling more money on the farmer won't increase production. Another million dollars would not immediately create new farmland or a more efficient tractor, and even if it did, it would not create more people to consume all the extra potatoes.
In a fiat currency system, diminishing returns on stimulus can easily lead to the trap of increasingly large stimulus packages to create the same level of perceived prosperity as previous packages. In a small monetary pool, a 1 trillion dollar increase in money supply can create immense change in spending behaviour. But after this stimulus becomes normalized and the overall pool is larger, the stimulus must increase dramatically to equal the same percentage of increase. This is how currencies can accelerate downward so quickly once the process of debasement is initiated.
So where could one look to see the initial signs of a deeper recession?

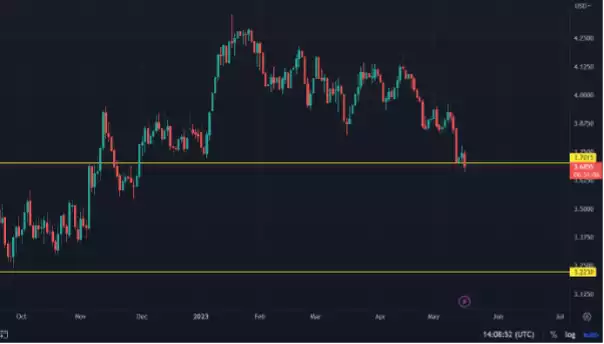
Copper (pictured above on a Daily candle chart) is used in virtually every aspect of modern industry and can be found in large quantities inside of appliances and electronic products. Therefore, a decrease in orders by factories can cause a slump in the price. First factories anticipate a downturn, then they order less copper, then distributors have less orders, retail stores receive less products, and eventually it becomes apparent that people are spending less and there is an economic slowdown. This is a major reason copper is looked at as a starting point for economic changes.
Looking at the chart above, it's evident that copper is testing a large support level and risks a 12% fall purely based on the support levels shown. This does not guarantee but can imply a further economic slowdown. This also clearly illustrates that there is a time-restricted flow for businesses to assess consumption, order raw materials, process, manufacture, and distribute. Monetary policy can change on a dime, but businesses take time and energy to adjust.

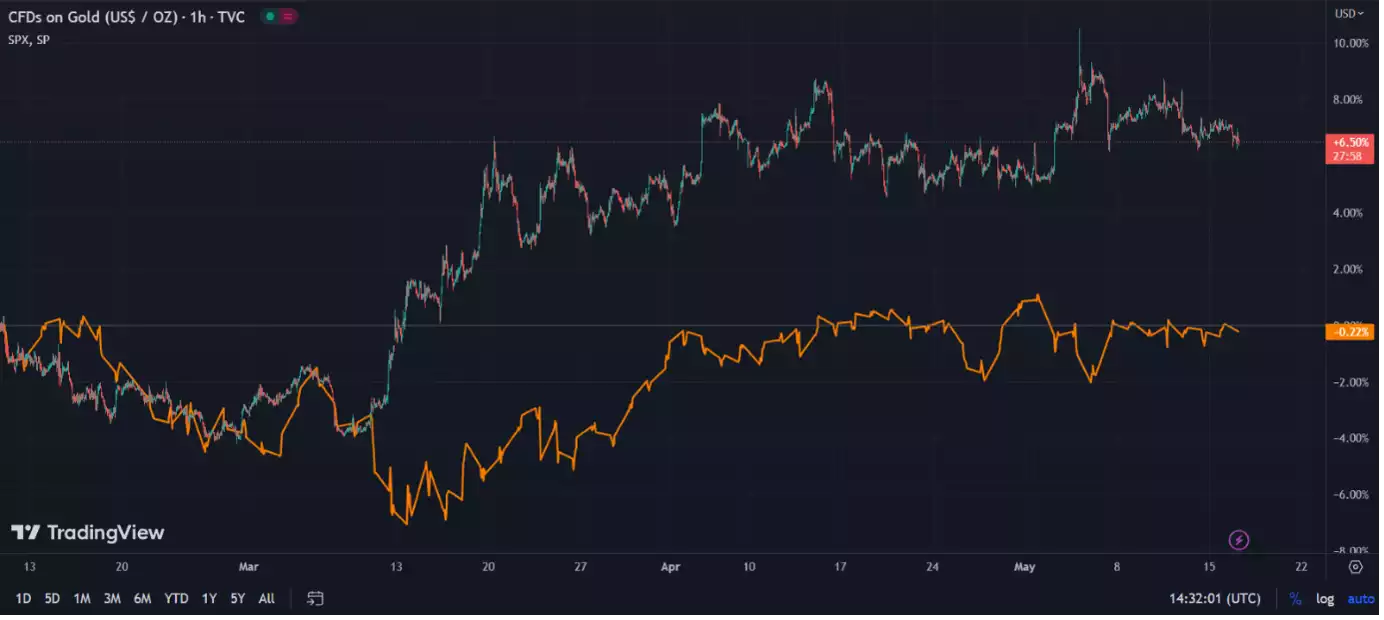
Lastly, the above chart illustrates gold's movements compared to the S&P 500 (in orange) since February this year. Although they have both been enjoying very similar movements in the past 3 years due to the devaluing of the dollars they are priced in, one can clearly see divergences happening. Notice the shocks pushing the S&P 500 downward and the coinciding spikes in the gold price. It appears that on this chart, gold has been once again displaying its power as a hedge against worst case scenarios and the stock market has been doing the opposite.
Submit your question to [email protected] and SUBSCRIBE to the YouTube Channel to be notified when the GSS Insights video is live.
**********************************************************************************