Parallels to the Roaring 20s - and What Came Next
News
|
Posted 02/01/2025
|
3021
In a new world of “Quantitative Easing infinity” (i.e. unlimited central bank intervention) since the Global Financial Crisis of 2008 - and markets today consequently being driven more by liquidity, than productivity - financial valuations make less sense every day. Much like the Roaring 20s, financial markets today are increasingly speculative - and we could be in a similar socioeconomic dynamic as that which preceded the Great Depression and World War II.
Social Parallels to the Roaring 20s
The Roaring Twenties was a time of economic boom, cultural change, and social rebellion:
- Economic boom
The decade following World War I saw unprecedented economic growth in Western countries.
- Consumer culture
The availability of credit—and mainstream adoption of electricity led to a booming consumer culture. Families and individuals bought more cars, appliances, and other consumer goods.
- Changing Gender Roles in the Jazz Age
Women challenged traditional gender roles by bobbing their hair, smoking cigarettes, and attending jazz clubs.
- Cultural changes
Complete rejection of past conventions and traditions gave birth to new cultural and societal trends.
- Conclusion of the era
The Roaring Twenties concluded with the most significant stock market crash in the last century, in 1929 - this led to the Great Depression.
In France, the 1920’s were known as the années folles, which means "crazy years".
Many would agree that the current decade of the 2020’s have parallels in consumer culture, rejection of traditional values, gender rebellion and are called the “crazy years” of our times.
Market Analysis - Early signs of risk appetite growing - The Russell 2000.
As markets become euphoric - they take on greater risk.
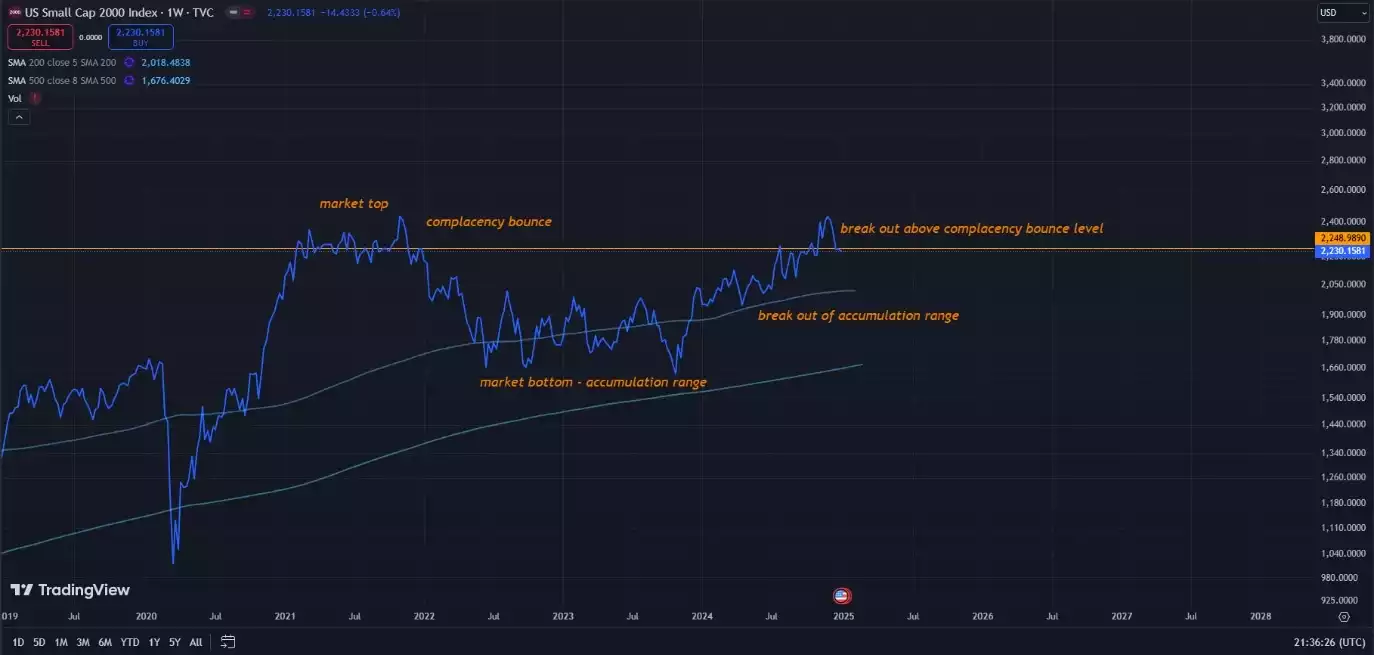
To evaluate how “risk on” investors are - we can look at traditional low market cap indices, such as the Russell 2000.
Bullish indicators on the Russell can reflect a stronger risk appetite among investors.

The “complacency bounce” shown above, usually provides strong resistance in an uptrend - as this is the last time markets “felt good” and experienced high volumes of trades. Closing and holding above this level is an early indicator of bullish strength in the market.
With the Russell 2000 having broken out of its accumulation range, and holding above the complacency bounce level - we see clear signs of bullish strength in this small cap market. This gives us an indication of greater risk appetite among investors - and points to the very early stages of euphoria entering financial markets - if the trend continues.
"Bull markets are born on pessimism, grow on skepticism, mature on optimism and die on euphoria." - Sir John Templeton
Cycle indicators
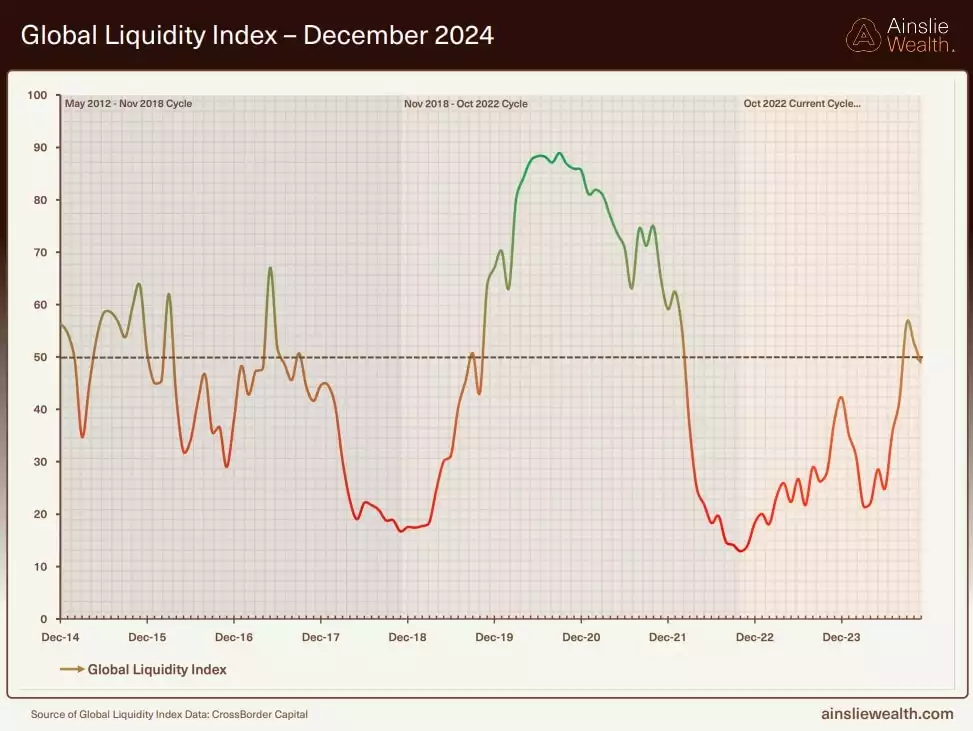
- The 4-6 year liquidity cycle
We are currently about 40% of the way through a macro liquidity cycle; the further along we get, the more money there is moving around the financial system, and the greater leverage, risk and euphoria enter financial markets.

- Final Phase of the 18.6 year land cycle
This upcoming liquidity-driven speculation - also overlays perfectly from a timing perspective, on the final phase of the 18.6-year economic cycle (coined “winner's curse” phase) which we are currently scheduled to be on the lookout for.
This phase of the macro cycle is typical of leverage, liquidity and valuations increasing exponentially - only to be followed by a broad-based collapse.
This macro land cycle is based on the past 200 years of data, where Western economies have recorded an economic cycle that averages 18.6 years (The shortest on record is 17 years, with the longest being 21 years).
Our most recent collapse, following a winner’s curse phase - was the global financial crisis in 2009. Most assets reached their peak value around 2007. As the cycle has a minimum of 17 years and a maximum of 21 years (with an average of 18.6 years) - we can expect this current cycle to peak (or the winner’s curse to conclude) between 2024 and 2028 (with an average expectation of roughly mid-2025).
- Final phase of an 80 year socio economic cycle.
The “Four Turnings” thesis (formulated by historians Neil Howe and William Strauss) suggests that society moves in 80-year macrocycles made up of four sub-cycles, each lasting about 20 years - called “turnings”. Every turning has its own generational archetype, specific role, and predictable result.
We are currently in a “fourth turning”, the previous fourth turning was during, you guessed it, the Great Depression.
First turning - involves the rise of powerful institutions. It is a time of hope and optimism, focusing on growth and prosperity.
Second turning - we see a rise of individuality and the institutions established in the first turning start facing opposition.
Third turning - individualism is truly alive, and institutions are perceived with increasing distrust. The focus here is on the self; and on having fun.
Fourth turning: is defined by war and revolution. Institutions are torn down and rebuilt for the sake of a nation's survival. Once the prevailing crises are overcome, society finds a sense of communal direction and unity, into the first turning of the next 80-year cycle.
Conclusion
Historical, land and liquidity cycles all point in the same direction, reaffirmed by current data. According to these, we can expect a flood of liquidity, speculation and euphoria, to increase and peak - leading to a broad based systemic and financial collapse - later this decade.
Here’s the good news
While increasing global liquidity raises all assets together, the following collapse that comes isn’t favourable to most assets.
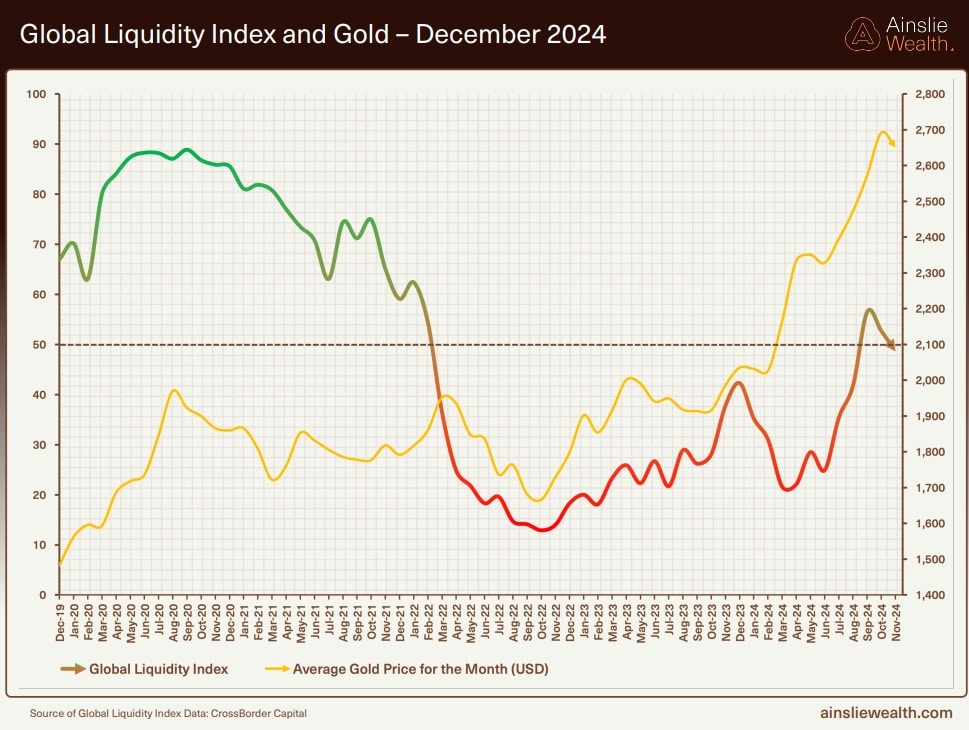
Gold and silver, however, are in a unique position of benefiting from both increasing global liquidity during the winner’s curse phase as well as the flight to safety requirement that proliferates the recession that follows. The chart below shows gold reacting to changes in global liquidity.

During times of crisis, investors seek assets not connected to any government or financial institution, with a proven track record - such as gold and silver. This causes a significant price increase in both gold and silver, leading to the crisis with gold outperforming silver, initially.
However, after the crisis as gold and silver have been increasing in value while most other markets are struggling – the average retail investors start paying attention - which drives speculation into these markets. With a smaller market capitalisation and lower liquidity, this speculation causes significant price increases in silver - causing silver to lead the way, subsequently outperforming gold, this causes the gold-to-silver ratio to reduce.
This is an opportunity to simultaneously capture significant capital growth, while securing a hedge against systemic collapses.
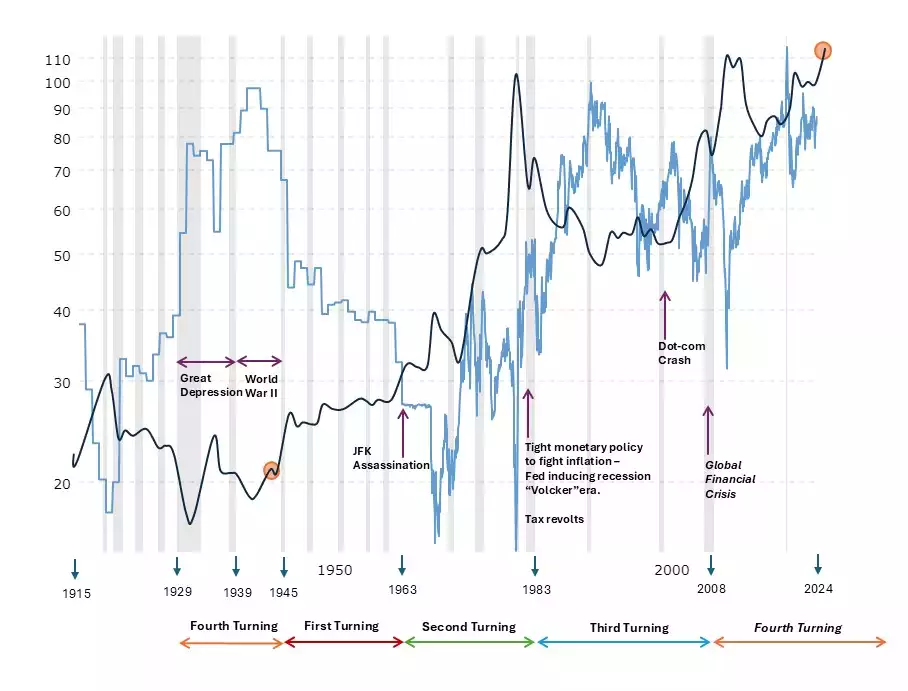
The image below shows the Gold to Silver Ratio (light blue) and the Silver USD price (dark blue) over the previous “four turnings”.

While navigating most assets can be chaotic leading into the winner’s curse - and the collapse that follows, precious metals such as gold and silver will play a key role in providing sustained growth, and shelter from the storm. Side-stepping the chaos, and rising to the top in the long term, during this macroeconomic phase.