Onchain Shows ‘Damage Is Done’
News
|
Posted 05/01/2022
|
10402
As 2021 wound down, so too did the activity in the Bitcoin market, with trading volumes softening, and prices trading more or less sideways. Price has continued to trade in the same range since late November, bouncing between a high of $51,654 US, and a low of $46,197 this week.
Across many on-chain metrics, there is a general lack of activity, despite a modestly bullish undertone in supply dynamics. Coins continue to migrate to increasingly illiquid, and dormant wallets, whilst investor profitability and cyclical metrics paint a more bearish picture. With a balance of both bull and bear signals at hand, the expectation for the start of 2022 is that we will see more consolidation and an eventual kick-off for the next bull cycle.
Generally speaking, bullish momentum is usually accompanied by increased demand for block space, as coins are purchased, sold, and transferred to new owners. Conversely, bearish trends typically see fewer new wallets, reduced transaction demand, and lower network utilisation.
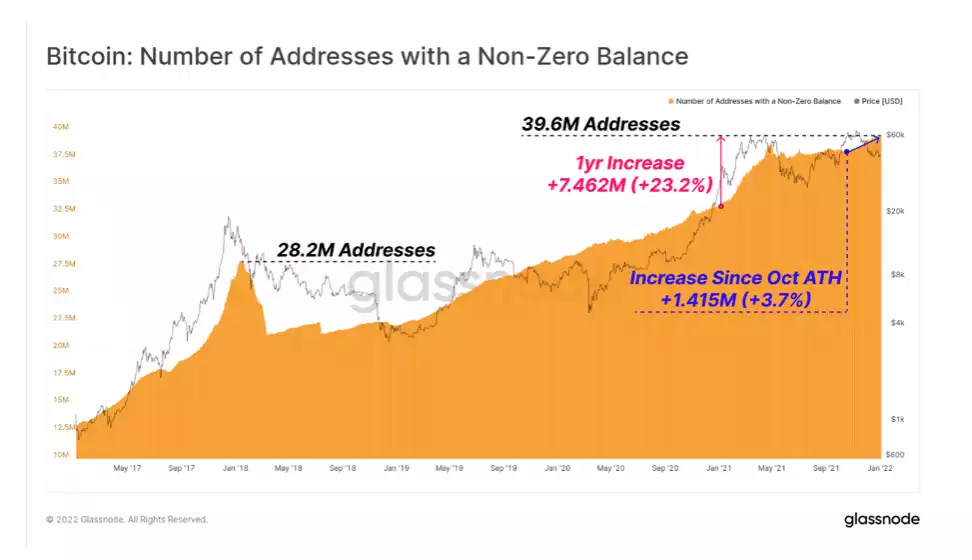
The number of addresses with a non-zero balance is a metric that can be used to assess the longer-term demand for Bitcoin. Over the last year, a net total of 7.462M non-zero balance wallets have been added to the network a 23.2% YoY growth. 1.415M of these were added since the October ATH, 18.9% of the yearly total.
The current ATH of 39.6M of non-zero addresses is 40% higher than the peak set at the end of the 2017 bull market, indicating that user-base growth has been sustained over the last five years.
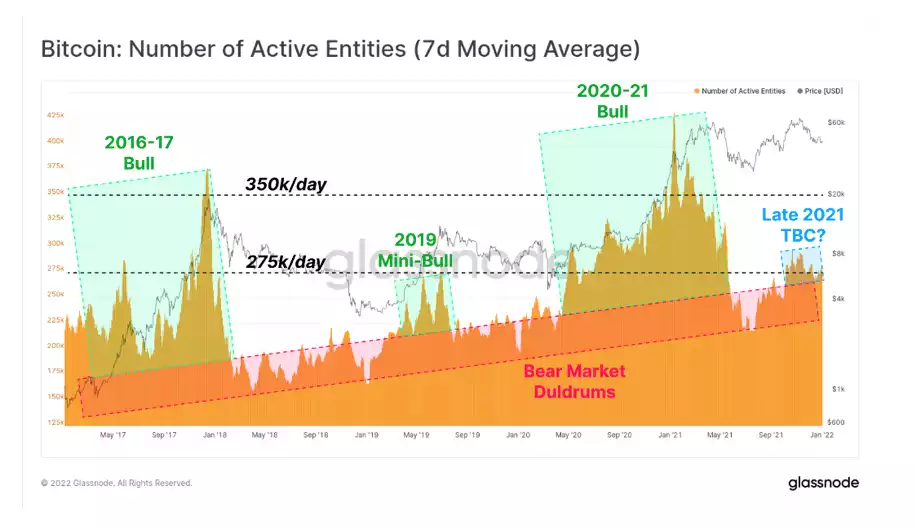
For daily activity, we can see that the number of active onchain entities has finally managed to break above 275k/day. The chart below highlights in red an observable and rising 'bear market channel'. This shows that during periods of depressed prices, and lower relative interest, there remains a persistent growth in network users.
Both 2017 and 2020-21 bull markets stand out as having markedly more onchain activity relative to this channel. However, the current regime appears to more closely resemble the 'mini-bull' that occurred from April to August 2019. These two periods are similar in that they followed a deep correction and broad capitulation event, but the subsequent rallies could not generate sufficient momentum for a full-scale bull market.
The rally in 2019 eventually culminated into a nine-month-long sideways-to-down trading range, until the final capitulation occurred in March 2020.
One of the hallmarks of bearish markets is a constructive undertone in supply dynamics. Whilst the onchain activity above points to fairly weak demand from retail, coin dormancy remains strong, and signs of smarter, more patient money accumulating remain intact.
December 2020 was the launching point for very strong price performance in Q1 2021, as Bitcoin broke the previous cycle $20k ATH, and pushed on reach over $64k in April.
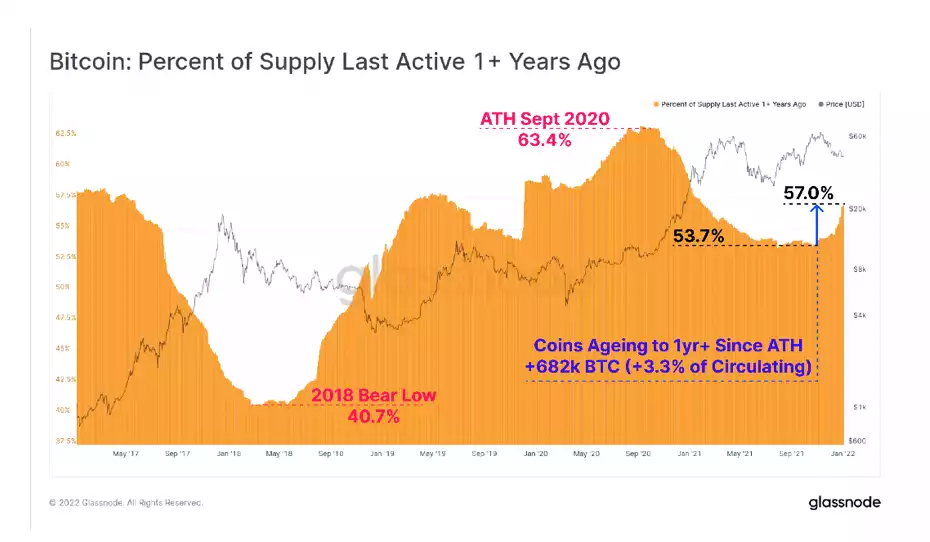
If we look at the supply last active 1y+ metric, we can see that a great proportion of coins accumulated in late 2020 remain unspent to this day. Since October 2021, over 682k BTC have migrated into the 1yr+ age band, representing 3.3% of the circulating coin supply. Over 57% of the coin supply is now older than 1yr, equivalent to the 51.5% seen at the time of the April 2019 bullish impulse.
Given how volatile 2021 was, seeing such an acceleration and a large proportion of coins held throughout is impressive.
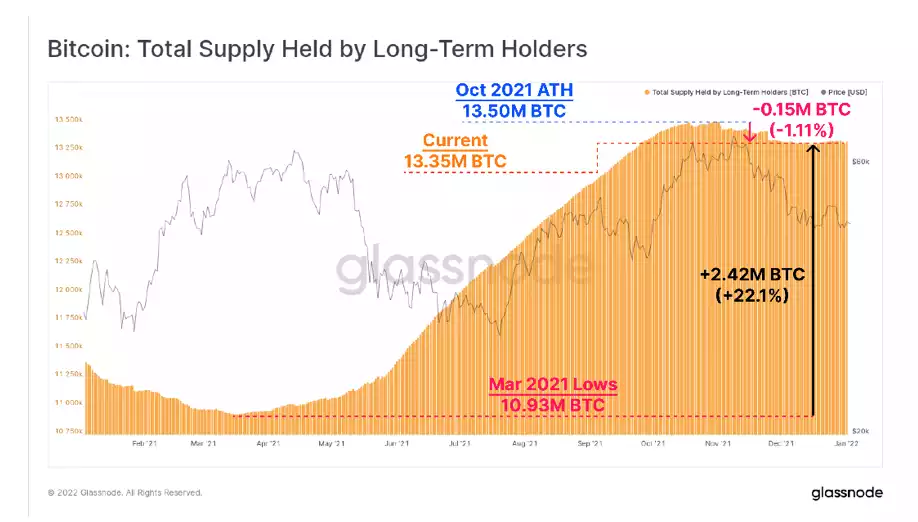
Long-Term Holder (LTH) supply has also plateaued after a very modest period of distribution following the twin ATHs in October and November. This signifies that LTHs have slowed their spending, and are more likely to be HODLers or even buyers at these prices. This provides another constructive view of market conviction.
LTH's have spent around 150k BTC since October which is just 1.11% of their total held balance. The slow-down in spending is notable given the sharp and sustained correction during this time. Note that this also follows a massive accumulation phase in 2021, where on net, over 2.42M BTC migrated to LTH wallets after March, a balanced growth of 22.1%.
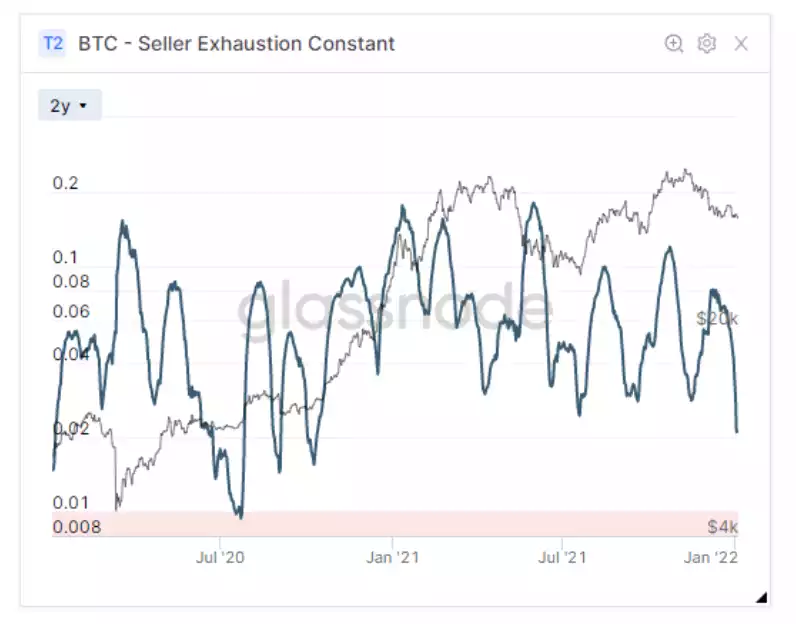
We have seen also seen a huge drop in the Seller Exhaustion Constant.
Seller Exhaustion Constant is defined as the product of the Percentage Supply in Profit and 30-day price volatility. It detects when two factors co-align: low volatility and high losses, or, in other words, low-risk bottoms.
When this metric is low, it indicates that we are seeing the following factors at play:
- High losses are being realised by short term holders
- We are seeing low volatility
- We are seeing the market provide a strong base - hence the low volatility despite the large selling pressure from STH's who are underwater at the moment
We have seen the metric lower in the past - notably just before the large bullish cycle in late 2020. Before that cycle kicked off, the market was very low in volatility and sellers were realising huge losses. As soon as these STH's ran out of selling pressure, the price took off. This further backs up that the market is in a consolidation range. Lows in the Seller Exhaustion Constant is the coiling of the spring for the bull cycle.
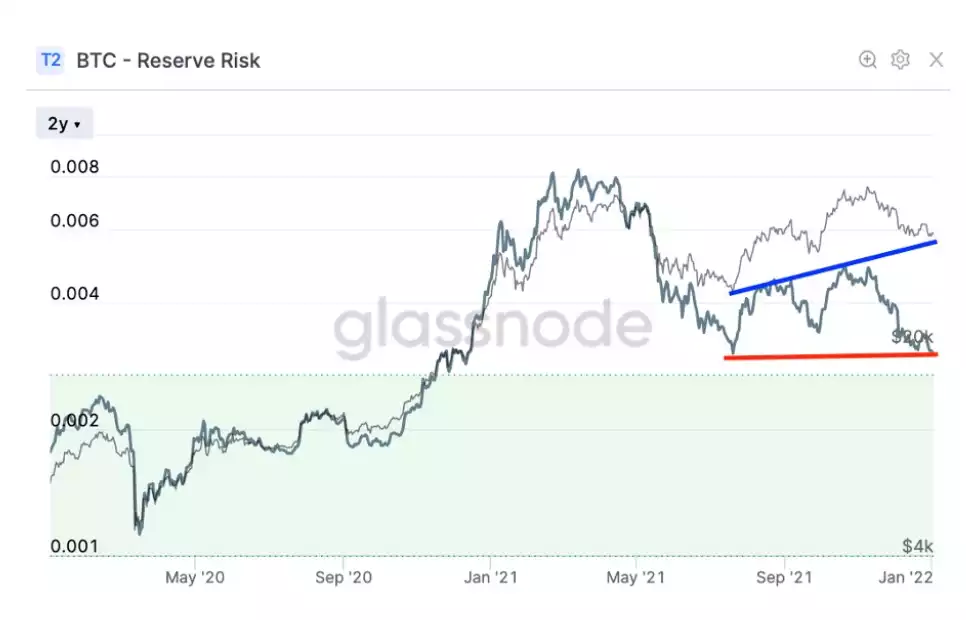
Reserve Risk is a cyclical indicator that tracks the risk-reward balance relative to the confidence and conviction of long-term holders. It provides a long-term cyclical oscillator that models the ratio between the current price (incentive to sell) and the conviction of long-term investors (opportunity cost of not selling). Reserve Risk is Low when HODLer conviction is high, unspent opportunity cost is increasing, and the price is low and thus, there is an attractive risk/reward to invest. A Reserve Risk ratio below 0.0026 is empirically presented as an area of undervaluation based on historical performance. We are currently at 0.0021. This means we can see some slight downside, but we have mostly seen the damage done. What has been most interesting in this metric is that we are at similar levels of HODL Ratio as we were after the spike low in the middle of last year. We are now at a higher price and seeing that same ratio now. We are also at a higher high from the last time the metric was at this level. So, while we are consolidating, we are also seeing a bullish bias.
