Market Blind-Sided by Manufacturing PMI Data
News
|
Posted 03/07/2024
|
1381
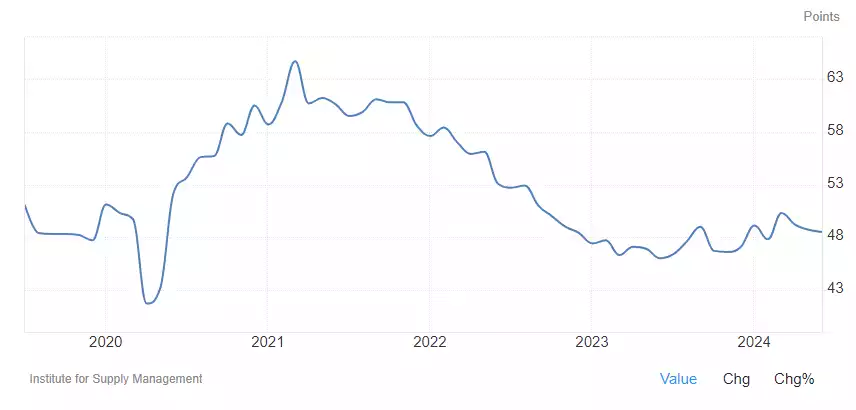
The recent ISM manufacturing index reported a PMI of 48.5% in June, down slightly from 48.7% in May. This marks the third consecutive month of contraction in the manufacturing sector and the 19th time in the last 20 months. The employment index also showed a decline to 49.3%, and while the new orders index improved to 49.3%, it remains in contraction territory.

A reminder of what the ISM and PMI figures mean: The Institute for Supply Management (ISM) releases the Purchasing Managers' Index (PMI) monthly to provide insight into the economic health of the manufacturing sector. A PMI above 50 indicates expansion, while below 50 signals contraction. The PMI is a composite index based on five major indicators: new orders, inventory levels, production, supplier deliveries, and the employment environment. The significance of the PMI coming in below expectations, particularly when already in contraction territory, signals that economic conditions are weaker than anticipated, which may prompt central banks to consider easing monetary policies to stimulate growth.
Economic activity in the manufacturing sector has contracted, but this retraction creates a runway for liquidity boosting, which you can read about in our latest macro and global liquidity analysis from last Friday. As central banks respond to these economic indicators, they may implement easing policies to stimulate further growth, which historically benefits the prices of gold and silver.
Drawing Parallels: Manufacturing Indexes Then and Now
During the lead-up to the Great Depression in 1929, manufacturing indexes also reflected significant contractions, signalling a decline in economic activity and foreshadowing the severe recession that followed. The Dow Jones Industrial Average plummeted by 23% over just two days, leading to widespread financial chaos and the onset of the Great Depression. Investors were caught off guard by the rapid decline, with many losing their fortunes overnight.
Today, similar fears are resurfacing as manufacturing indexes show persistent contractions. The current economic landscape, with mixed data and inflationary pressures, evokes concerns of another significant downturn. The ISM manufacturing index's decline in June, coupled with the broader economic uncertainty, has raised alarms about the potential for a recession akin to the one experienced in the 1930s.
The only way out? Fire up the printers and boost liquidity in the system.
Global Liquidity and Economic Indicators
Global liquidity, a crucial indicator for financial markets, is recovering from recent lows. As liquidity improves, so too do the prospects for gold and silver. Historically, increased global liquidity has driven up the prices of these precious metals. The current environment, marked by geopolitical tensions and inflationary pressures, mirrors conditions that have historically supported the value of gold and silver as safe-haven assets.
Global Liquidity Cycle
Global liquidity is recovering from cycle lows, showing improvement that benefits gold and silver prices. Historical patterns suggest that increased liquidity drives up the prices of these metals, supporting their role as safe-haven assets.
Gold and Silver Trends
Gold prices have been rising consistently since their cycle low in September 2022, reaching new all-time highs. Silver has followed a similar trajectory, with recent gains reflecting its value as a versatile investment.
By incorporating physical gold and silver into your portfolio, you can mitigate risks and capitalise on opportunities that arise from market volatility. Protect your blind side with gold and silver, and rest assured that your financial future is strong.