Major Technical Indicator Warns of Potential Market Volatility
News
|
Posted 23/07/2025
|
1576
The two primary safe haven assets of choice for central banks and institutions are gold and US bonds (albeit the latter increasingly falling out of favour of late). When demand floods into gold or US bonds, it is usually amid a panic or financial crisis. This leads to the gold price spiking and the US bond collateral rising (with bond yields dropping).
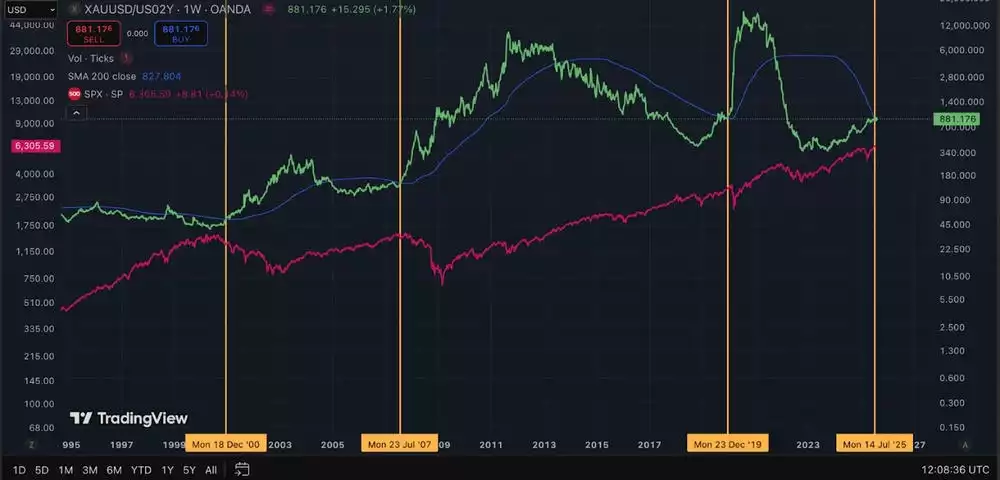
With this in mind, an indicator that can capture this risk-off liquidity flow is created by dividing the gold price by the US 2-year bond yield.
A spike in this figure indicates a combination of the gold price increasing and the US bond yields dropping, perfectly capturing moments of larger players in financial markets, ducking for cover.
Below we can note three instances in the past 25 years where the Gold/US02Y has crossed over the 200-week moving average, after spending a prolonged period below. These marked clear changes in momentum.

The first two flashed around major peaks in stocks and were followed by prolonged bear markets, with the most recent example marking a quick panic dip which resulted in a record amount of money printing and quantitative easing. This lead to a huge spike in global liquidity and a rally across most markets.
Today we can observe once again, this indicator crossing over the 200-week moving average.
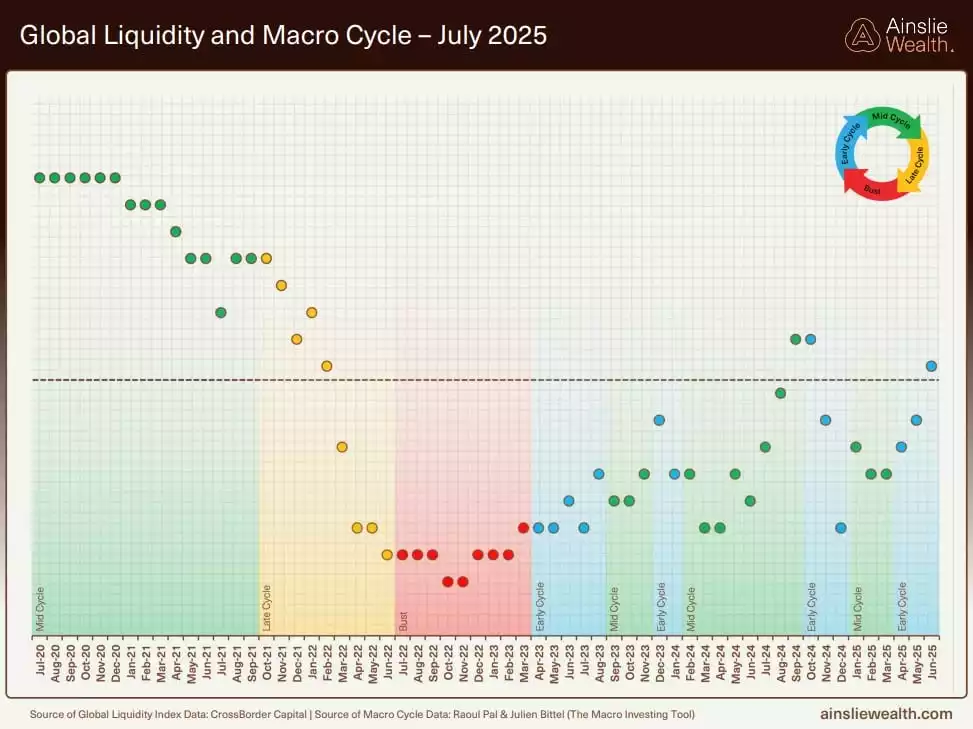
An understanding of the business cycle still being between early and mid-stages due to the US Fed’s fight against inflation—leading to a stop-start liquidity cycle—could mean that any sudden credit event is dealt with by flooding the system with liquidity. If this were the case - while this volatility would be worrying in the immediate term - the overall reaction to this could (counter-intuitively) result in a huge risk-on blow-off rally.

Additionally, with the 18.6-year land-debt cycle being in its final stage of the uptrend where liquidity and leverage, along with most markets, have historically risen exponentially—before a broad-based financial crash—this potential upcoming turbulence could help justify the liquidity, similar to the C19 era.
A fall in the US bond yields would also ultimately improve liquidity conditions by raising bond collateral, while creating an environment within the bond market that favours interest rate cuts – leaving the Fed with no more excuse to hold interest rates at current levels.
All of this in the long term is incredibly inflationary, however, meaning while governments inflate away the real value of their debt, everyday hard-working citizens pay the price for this via the hidden tax of inflation. Owners of hard assets like gold and silver will be the ultimate beneficiaries long-term of an ongoing currency devaluation.
It is also crucial to note that while the land and business cycle might suggest an influx of liquidity would be a logical solution to market turbulence, complacency is never an option, and all possibilities are always on the table in financial markets—meaning the likelihood of this being a macro peak, followed by a long and drawn out bear market for stocks remains one to be vigilant of, as this technical indicator comes to fruition, next month.
Regardless of whether the upcoming turbulence results in a quick, short-term peak, or a longer-term, macro peak for stocks, gold and silver are primed to perform well in the final phase of the uptrend, and to significantly outperform most other financial assets in the recovery phase which follows the macro peak.
In the previous macro peak, which led to the 2008 Global Financial Crisis, while stocks (pink) and land (blue) spent years recovering, gold and silver continued with strong rallies, with silver outperforming gold during this time, reflected in the Gold to Silver Ratio (green) falling off.

Watch the insights video inspired by this article here: https://www.youtube.com/watch?v=5_QqfW8OESw