Major Recession Draws Closer as Economic Indicators Worsen
News
|
Posted 24/04/2025
|
1894
While many astute investors are on the lookout for an impending global recession, it is important to note that the closer we get to it, the higher major stock markets will be. This results in fewer market participants anticipating it, with a majority entering a state of complacency as valuations continue to rise. However, while valuations continue rising – the cracks in the economy worsen, and multiple economic figures and technical indicators start flashing red, giving investors a clear heads-up about what’s to come. Keeping an eye on these figures and technical indicators can help investors stay grounded by anticipating recessions, while most are focused on rising markets artificially inflated by central bank policy.
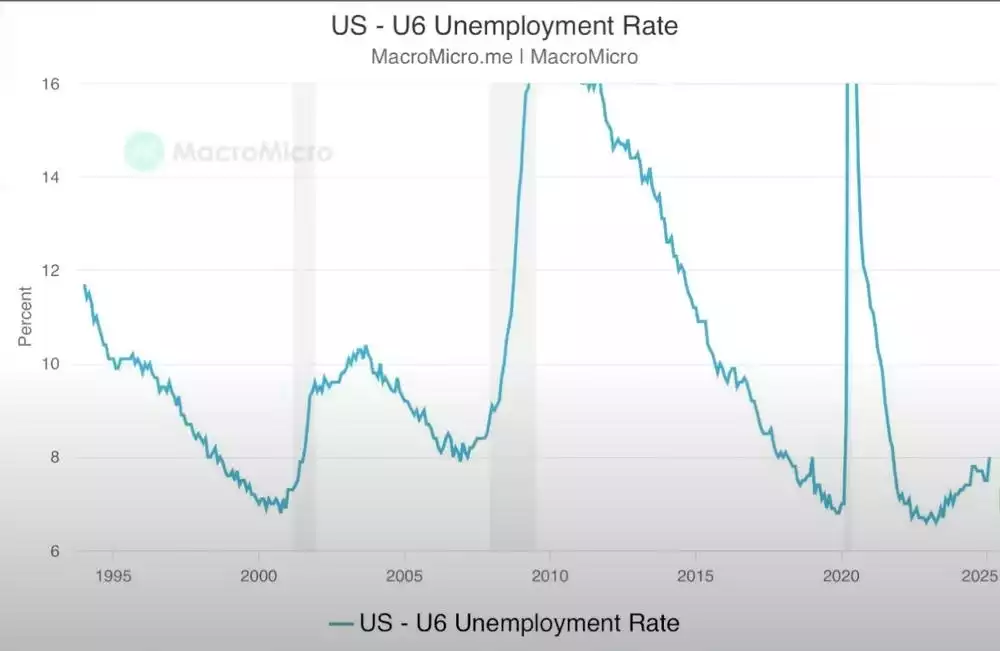
U6 Unemployment Rate
This is usually a precursor to major recessions (shaded in grey). The closer we get; the more unemployment rises before sudden acceleration.

Currently, we can see we are turning up in what looks like a lead-in phase to the sudden acceleration. While this could roll over, and chop around sideways, in the mid-term - currently it has shown no signs of the uptrend slowing. It is important to keep an eye out for sudden acceleration to the upside (with the most recent reading potentially hinting at this).
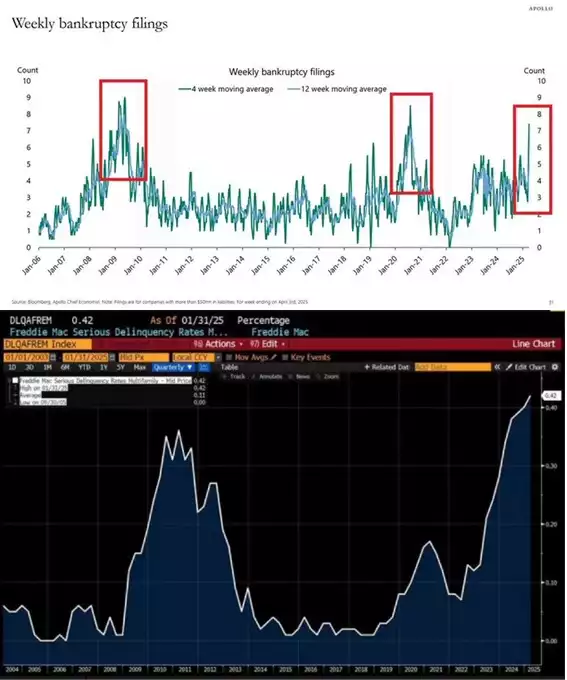
US Weekly Bankruptcy filings & Mortgage Delinquency
US bankruptcies are accelerating to recessionary levels. Outside of 2020, this is the highest level since the Financial Crisis.

Even more concerning is that 6.1 million Americans are behind on their mortgage. The chart below shows us that delinquency for multi-family homes is currently higher than at the peak of the Global Financial Crisis.
While both these signals are already flashing red, they could get even worse before a recession is finally declared.
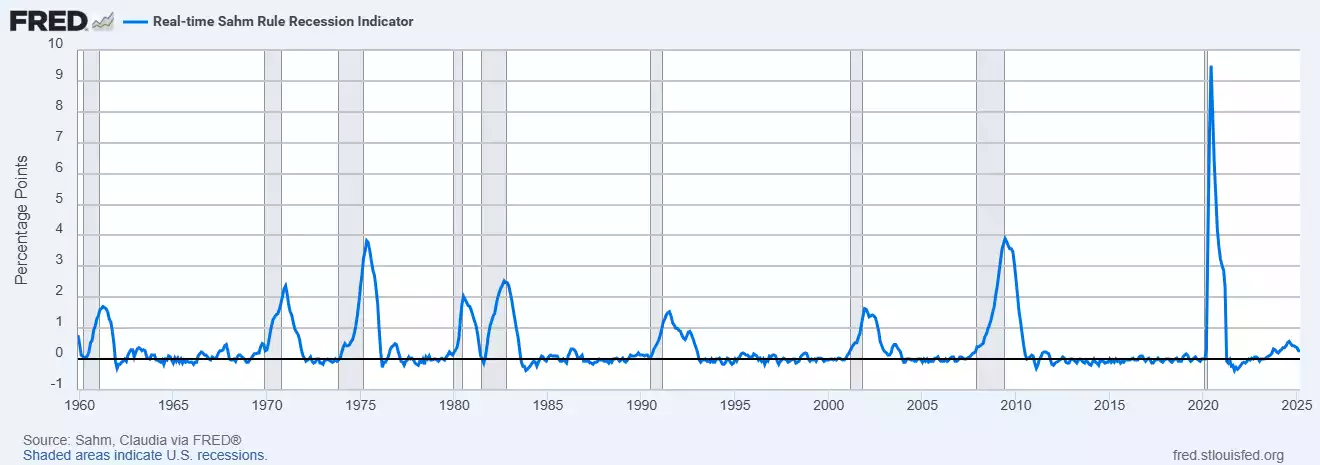
Sahm Recession Rule Indicator
Sahm Recession Indicator signals the start of a recession when the three-month moving average of the national unemployment rate (U3) rises by 0.50 percentage points or more, relative to the minimum of the three-month averages, from the previous 12 months.
Once a recession hits, we see an acceleration in this indicator to the upside (shaded in grey).
Similar to the unemployment rate, we see that the Sahm recession rule indicator currently shows a gradual lead-in phase of higher highs and higher lows (synonymous with a phase prior to acceleration to the upside).

Those who do not want the recession to arrive would be keeping a very close eye on this indicator to look out for the current uptrend breaking down and rolling over.
If the current uptrend of higher highs and higher lows breaks down, it would indicate further sideways chop, meaning the acceleration phase still has time to go with the lead-in phase taking longer.
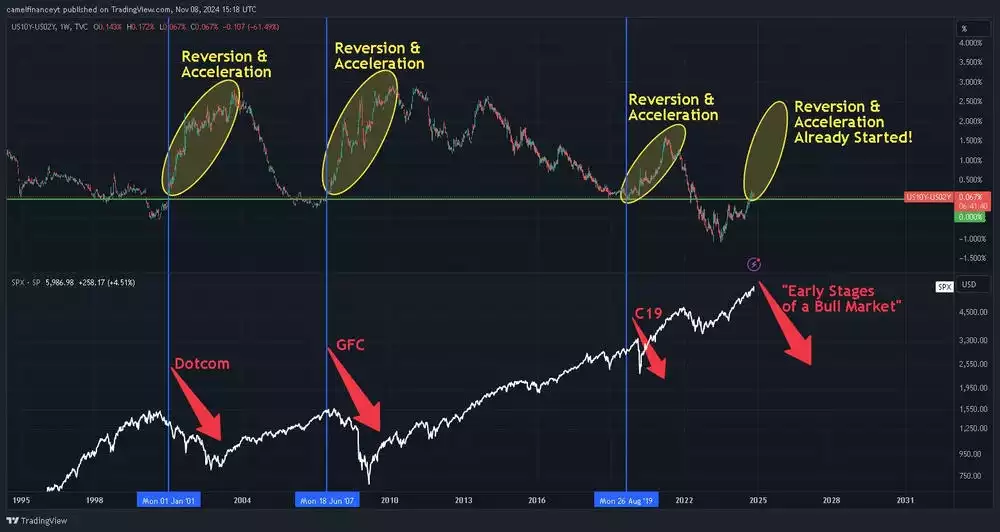
The US 10Y - US 02Y Bond Yield Spread
A well-known leading indicator is the difference between the US 10Y and US 02Y bond yields. While many look for the yield curve inverting or un-inverting as a recessionary signal, the true signal is the acceleration to the upside, after the yield curve un-inverts.
Currently we have seen it invert, un-invert and chop around without any acceleration as yet. However, with a clear uptrend of higher highs and higher lows, it appears the upward acceleration could be what comes next - unless this uptrend rolls over soon.

While these indicators are crucial to track for those in risk assets, stocks and leveraged (or shorter-term) investment properties, precious metals investors can simply take a long-term view instead. This is because while gold and silver (as hard assets) benefit from the increasing liquidity in this final phase, of the macro uptrend, they also continue to perform well in the recovery phase (right after the collapse), being flight to safety assets.
While most other assets struggle in the recovery phase, and gold and silver continue to record consistent capital growth, investor speculation enters the precious metals space.
Silver, with its small market cap, experiences significantly larger percentage gains in this environment of institutional and retail speculation. Silver therefore outperforms gold in this post-collapse phase, with the gold-to-silver ratio (GSR) falling off.
With the GSR currently over 100, getting into silver early will allow investors to front-run this frenzy and take advantage of silver being undervalued, while most investors are distracted by the final uptrend phase of the land, stocks and risk markets.