Macro and Global Liquidity Analysis: Gold, Silver, and Bitcoin – October 2025
News
|
Posted 31/10/2025
|
3871
Today, the Ainslie Research team brings you the latest monthly update on where we are in the Global Macro Cycle, driven by the Global Liquidity Cycle, and the implications for Gold, Silver, and Bitcoin. This summary highlights the key charts discussed with our expert panel on Tuesday. We encourage you to watch the recorded video of the presentation in full for the detailed explanations.
Where are we currently in the cycles?
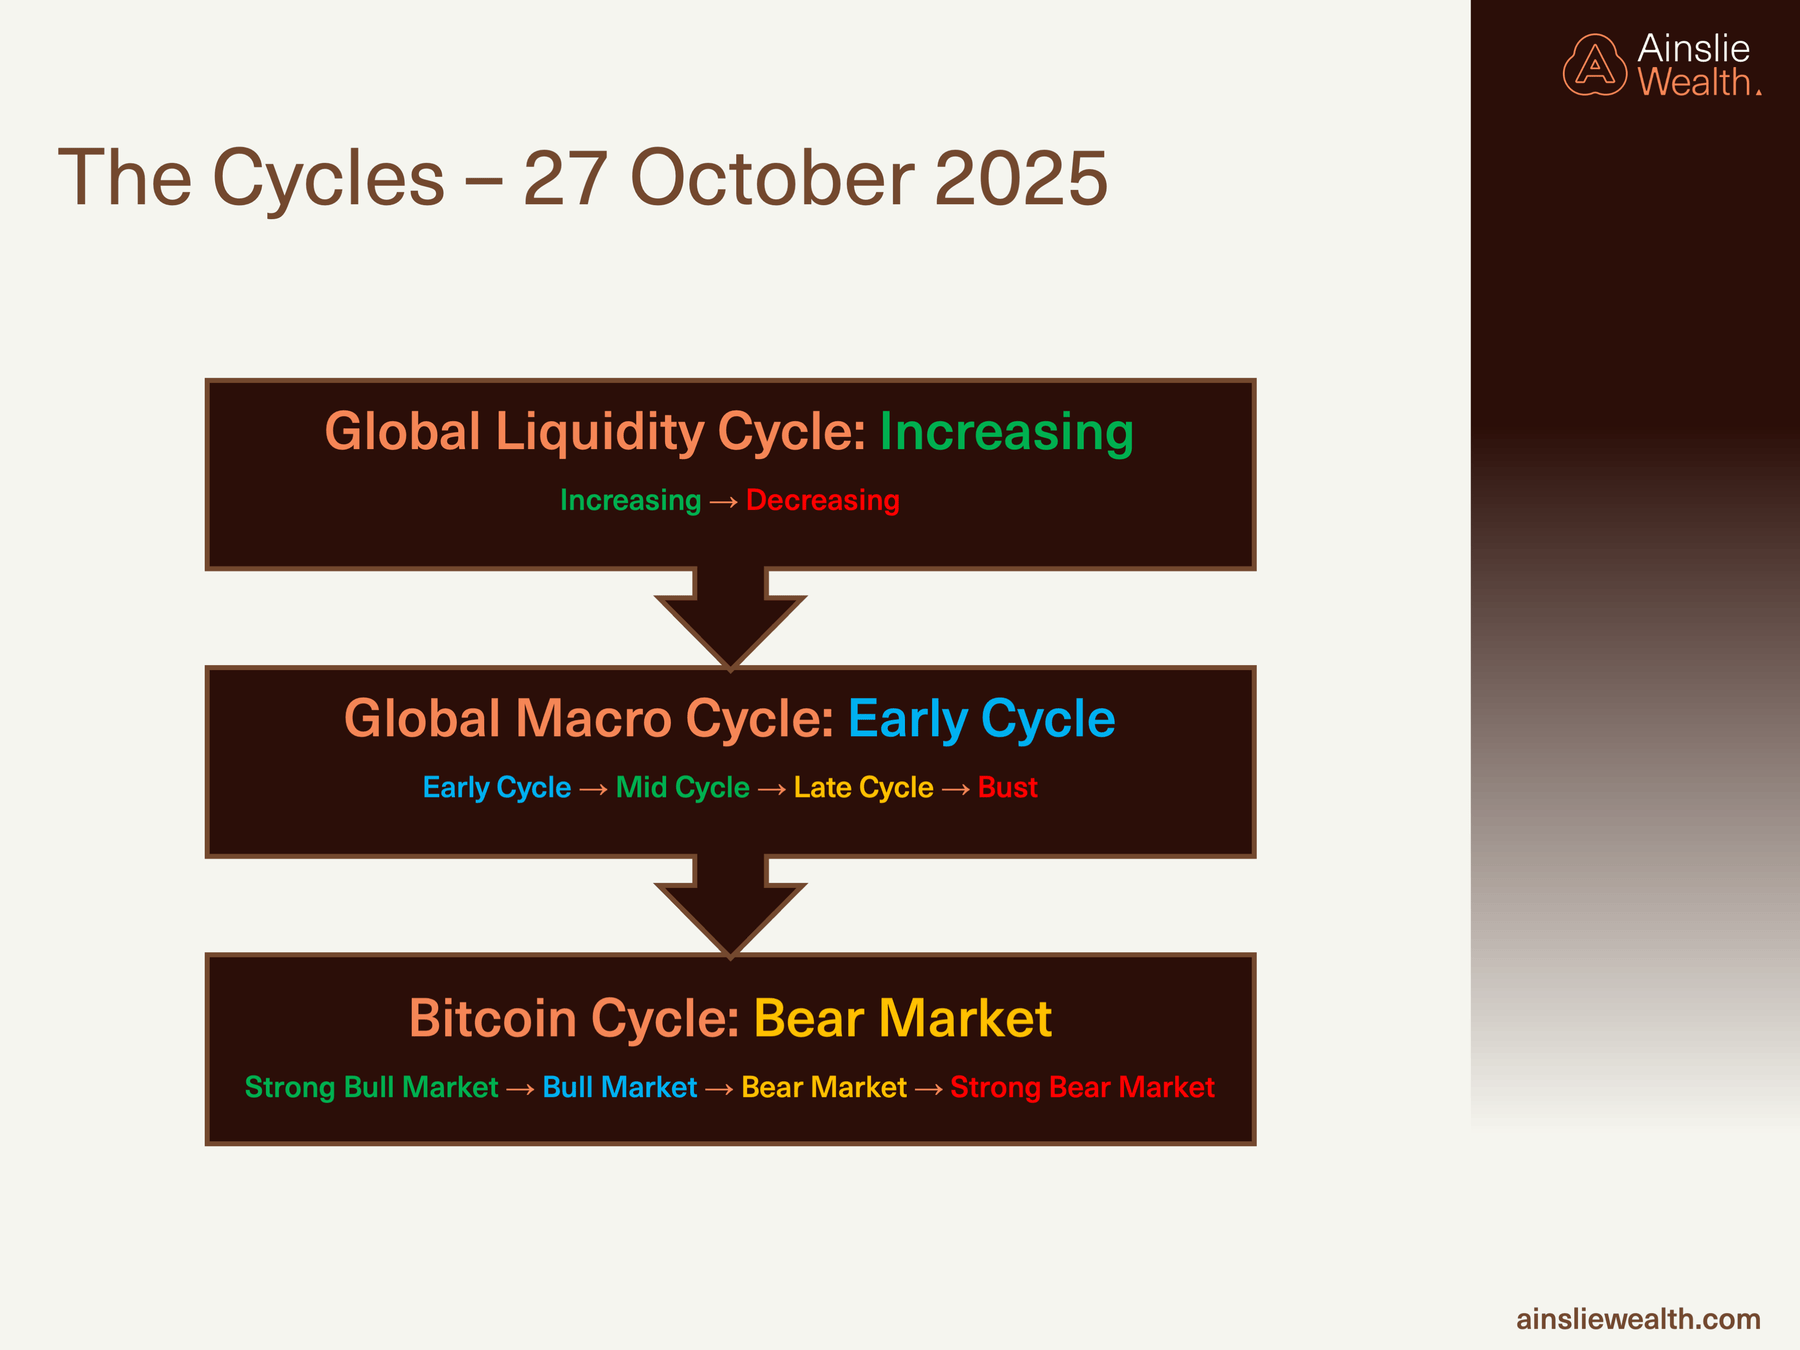
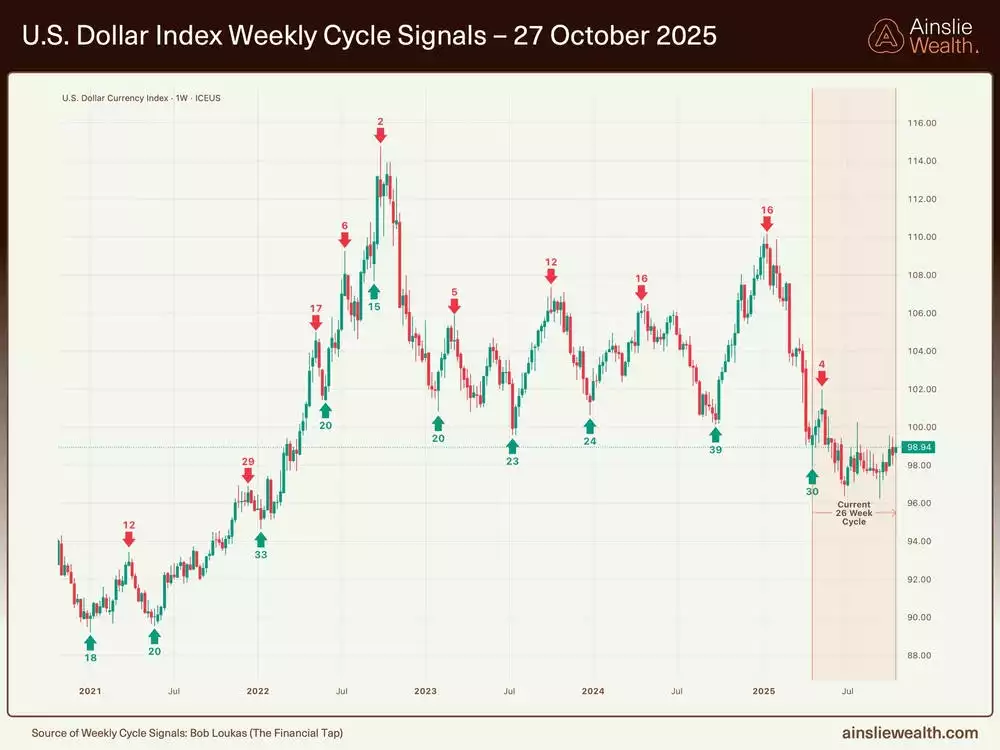
Recent assessments indicate the market remains in an early cycle phase, with liquidity dynamics showing signs of maturation after over two and a half years of expansion, suggesting proximity to a transition toward mid-cycle rather than the onset of a downturn. Global equity trends continue upward nominally, yet the rate of change in liquidity has moderated, creating a disconnect that could lead to asset price stagnation amid persistent economic growth signals. Bitcoin has exhibited temporary bearish signals that warrant caution but align with broader liquidity trends, while precious metals have demonstrated robust performance followed by retracements, reflecting the ongoing debasement narrative. This setup implies potential for continued upside in the near term, particularly through year-end, but emphasises the need for vigilant monitoring of liquidity inflection points to navigate emerging volatility and capitalise on cycle-driven opportunities.
Deep dive on the Global Liquidity Cycle
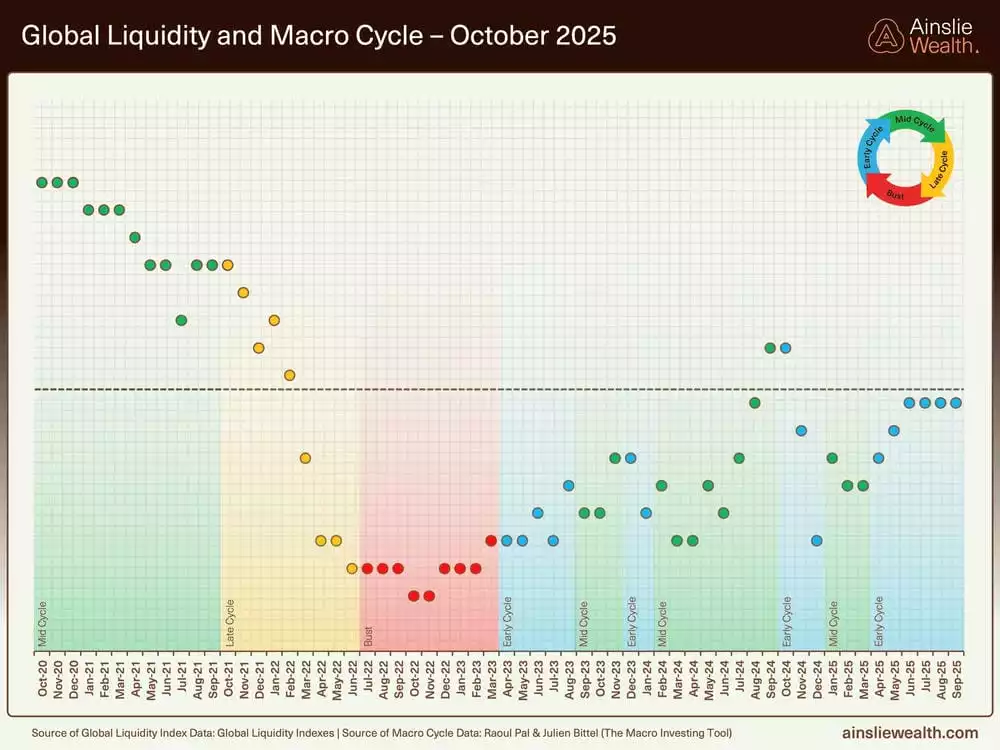
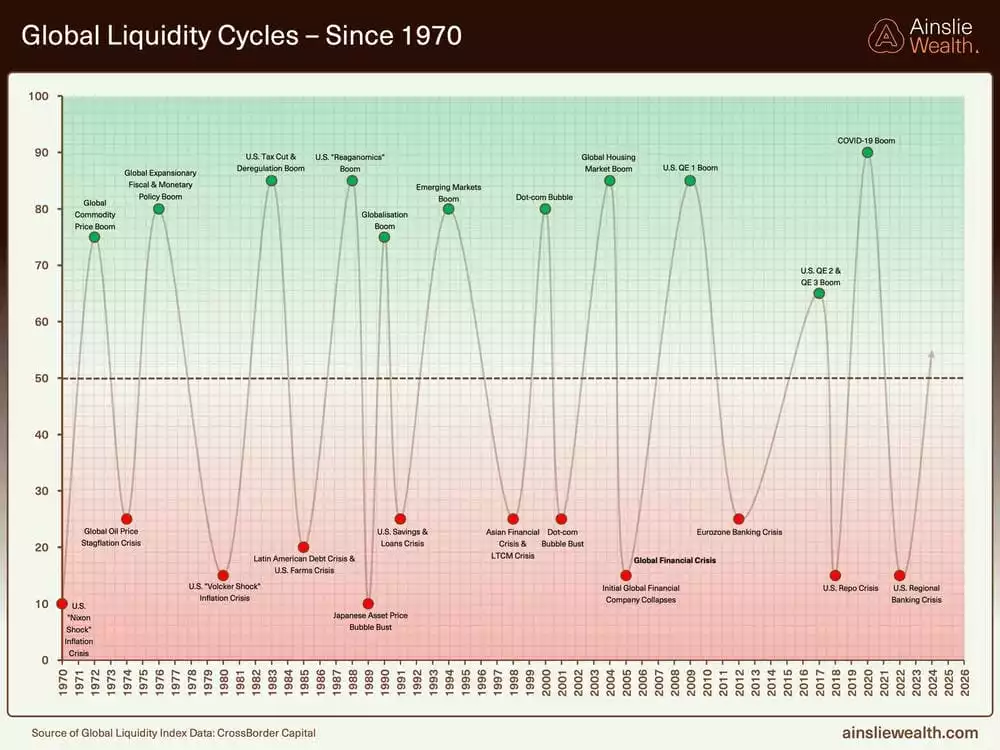
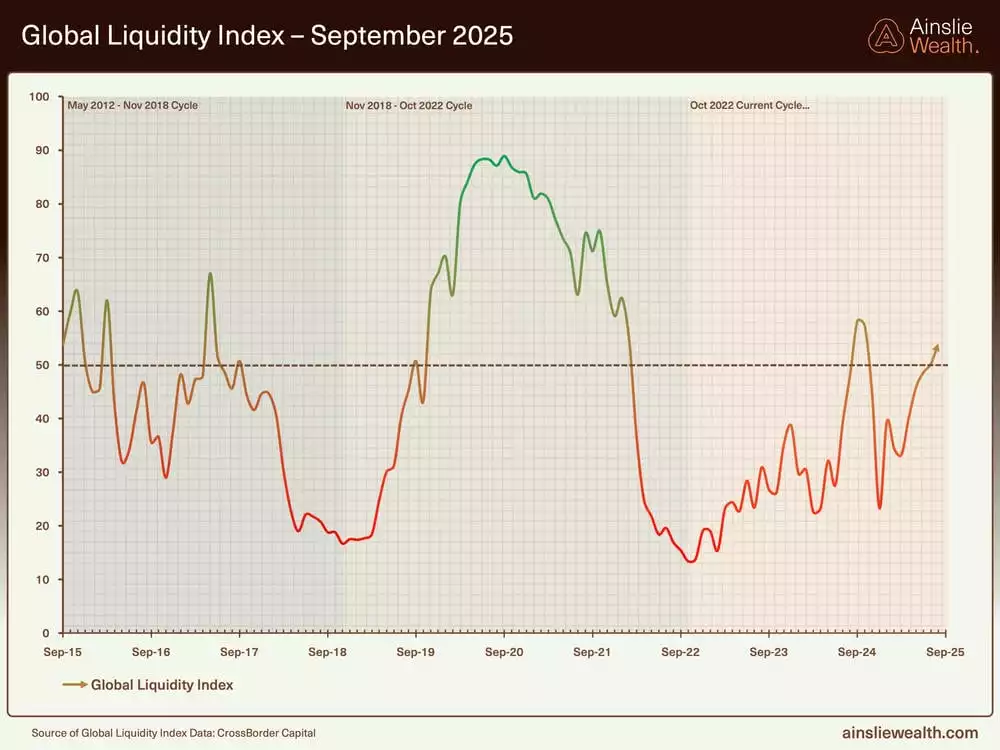
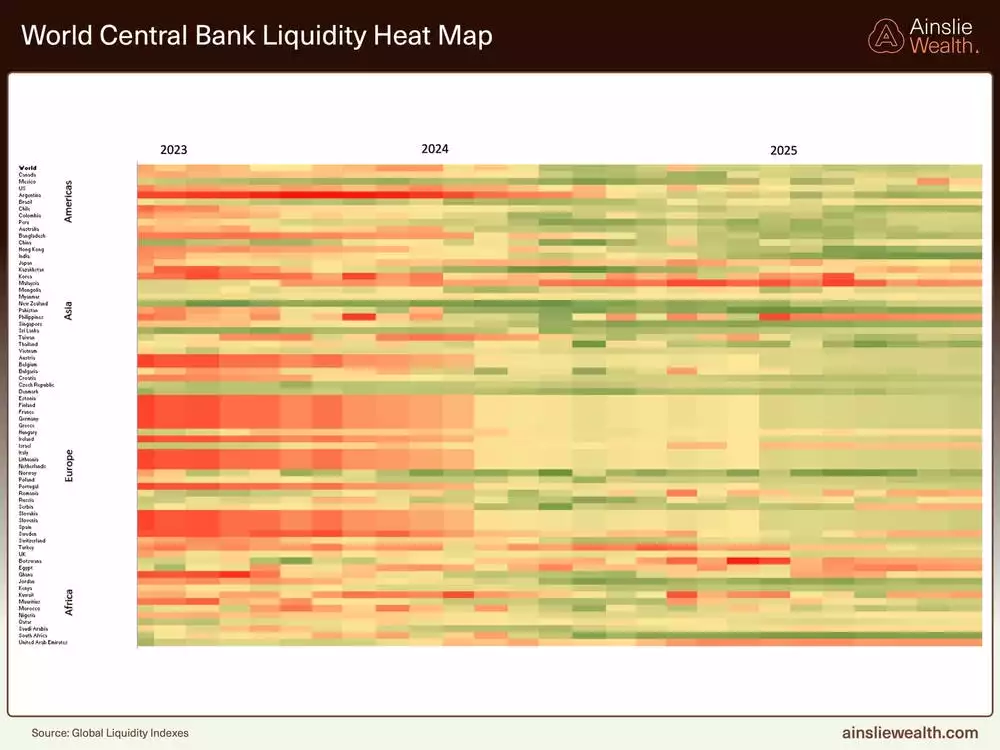
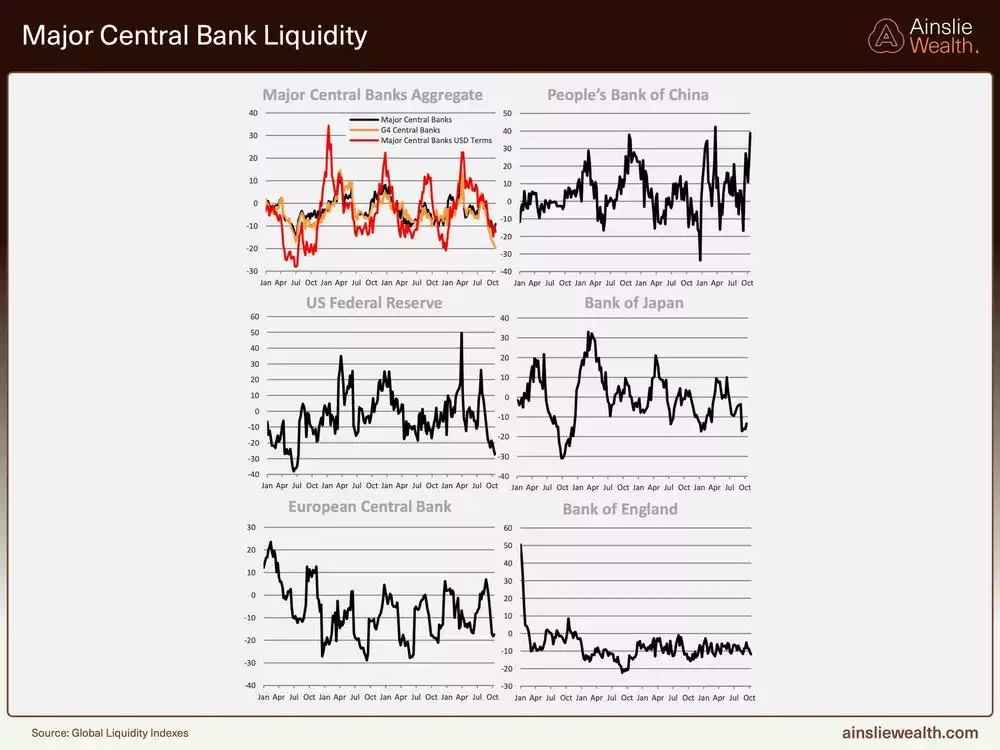
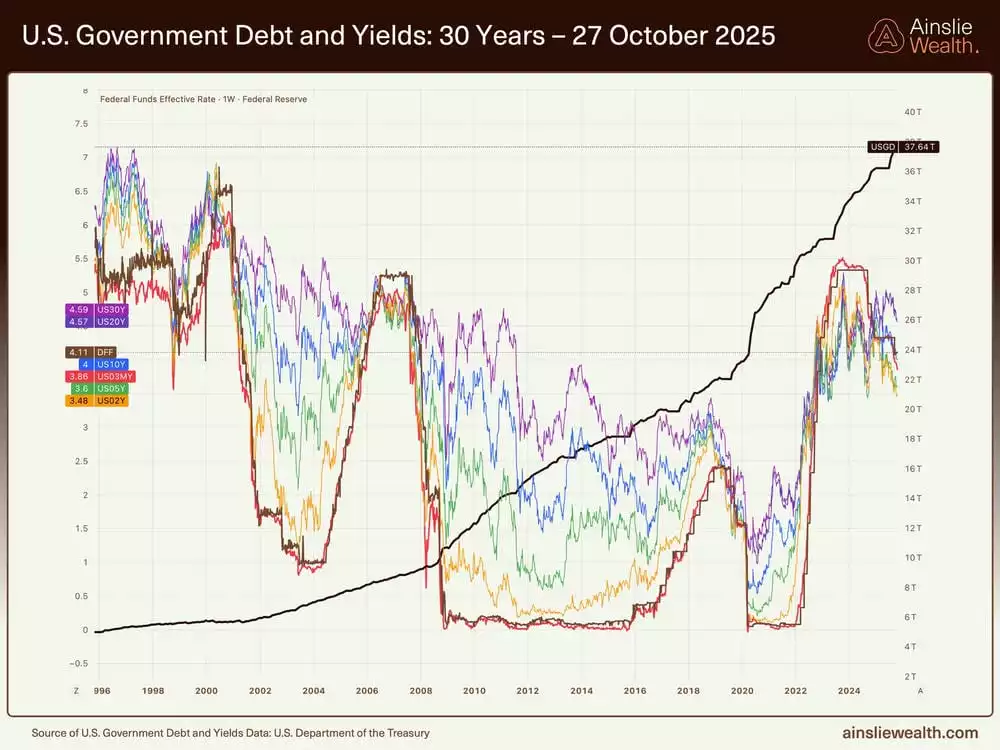
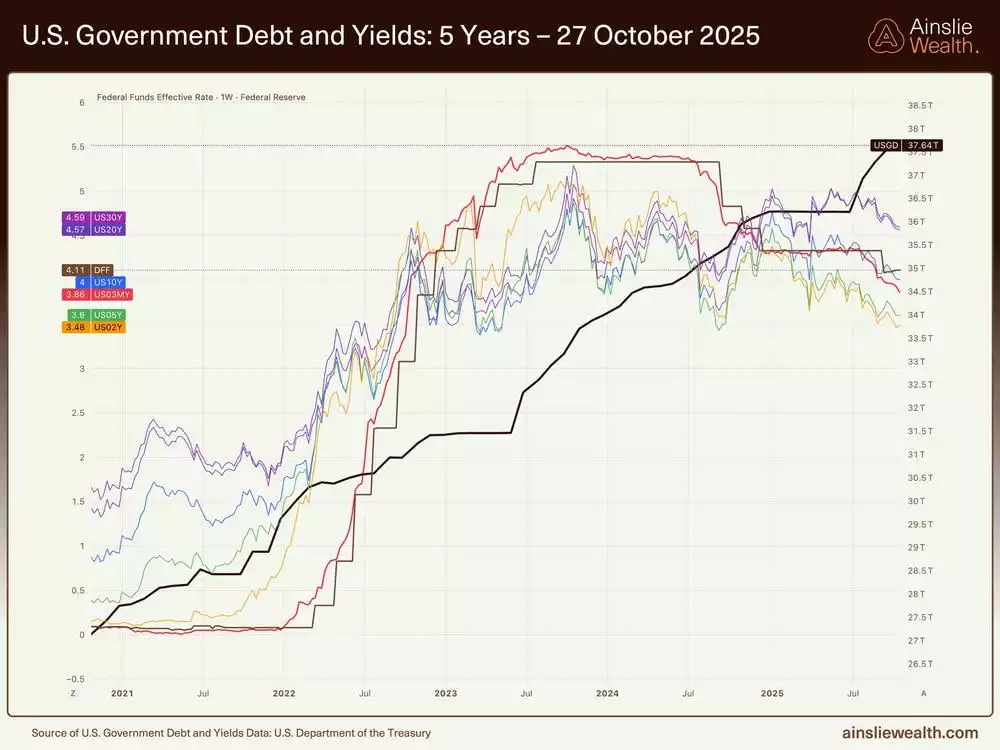
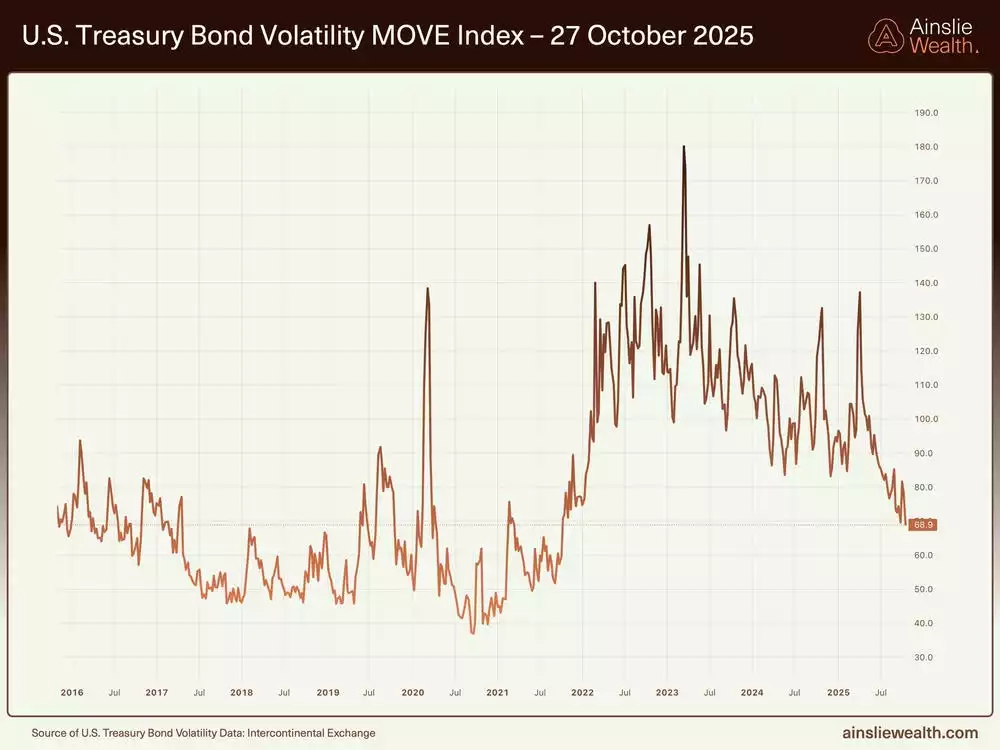
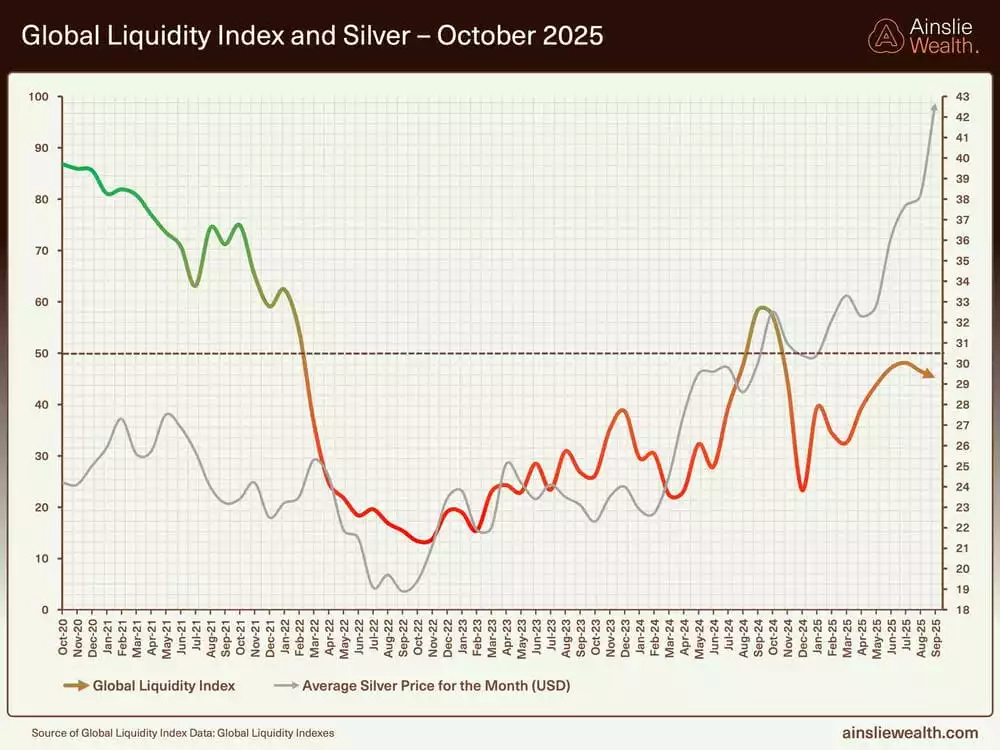
Global liquidity maintains an upward trajectory in nominal terms, driven by factors such as declining bond volatility, rising collateral values from lower yields, and substantial short-term bill issuance, though the rate of change has stalled, signalling a potential slowdown that markets may front-run through profit-taking. Central banks, excluding China, have contributed to tightening, with developed markets like the US, ECB, and Bank of England reducing liquidity at annualised rates in the teens to twenties, offset partially by China's aggressive 39% expansion, highlighting reliance on fiscal mechanisms over traditional quantitative easing. This shift toward slower fiscal transmission, including treasury general account drawdowns and targeted real economy spending, could extend the cycle but risks headwinds if volatility spikes or issuance patterns falter post-year-end. Overall, the environment supports short-term positivity, particularly with anticipated bill issuance comprising 60-70% of treasury activity, yet underscores the importance of rate-of-change metrics in forecasting asset responses amid a maturing cycle.


Deep dive on the Global Macro Cycle
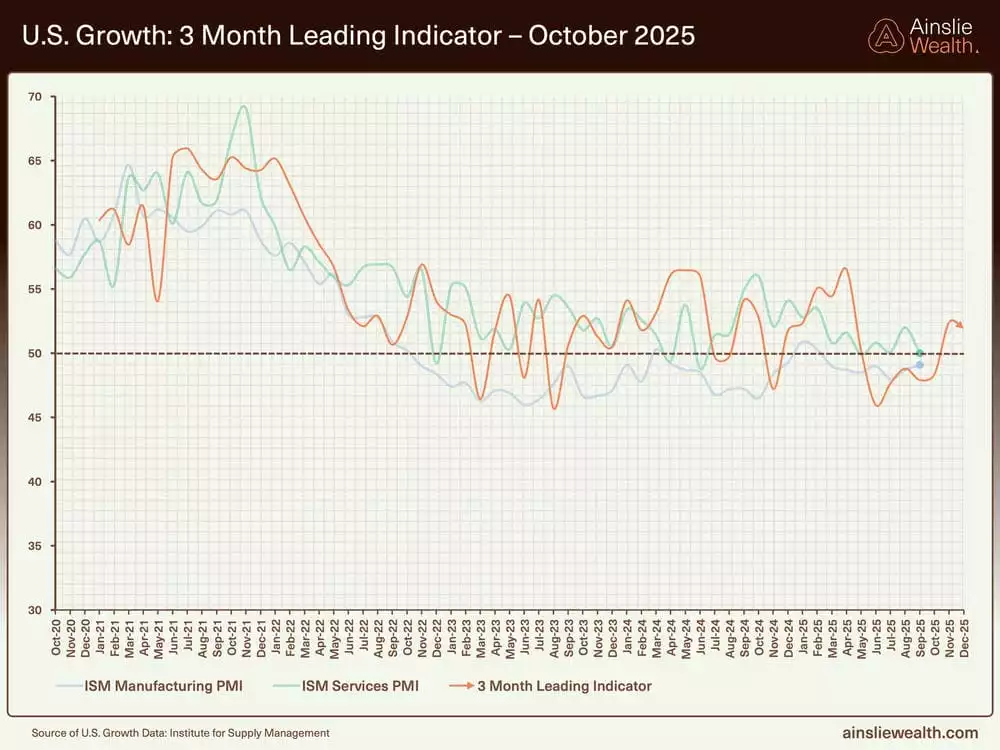
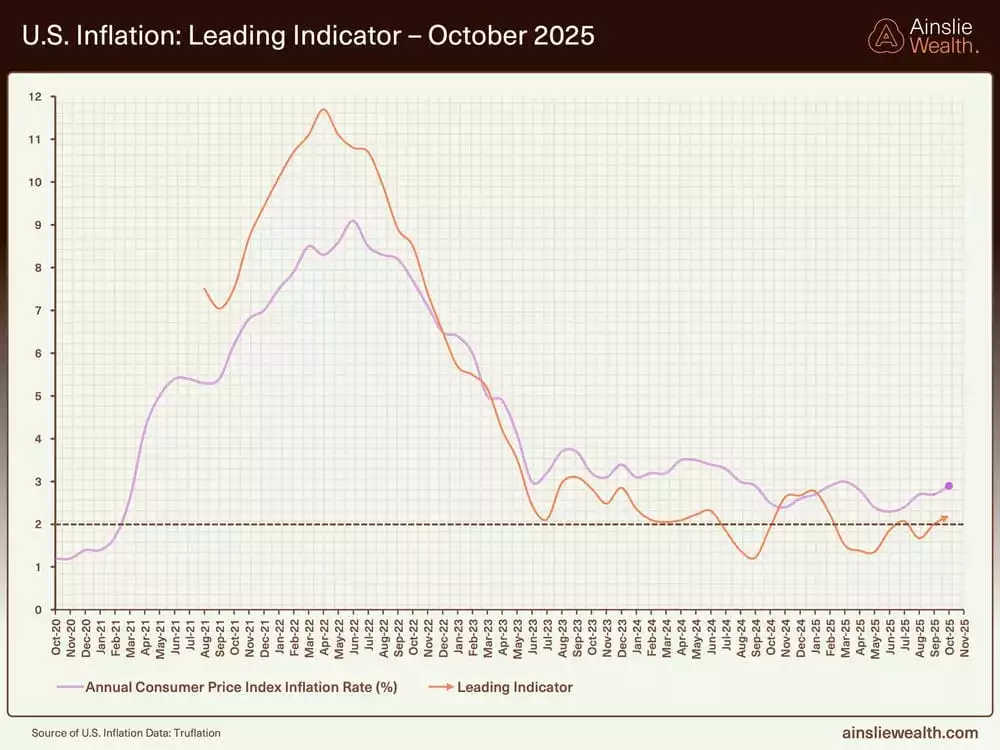
The macro cycle displays strengthening growth indicators, with global PMIs around 52 and US data, including Kansas Fed releases, pointing to expansion in manufacturing and services, countering recession narratives and suggesting an imminent shift to mid-cycle as headwinds like tariffs ease. Inflation remains subdued at around 3%, potentially establishing a new normal that pressures bond markets if spending accelerates, while employment concerns drive policy toward easing without immediate quantitative measures to avoid exacerbating wealth inequality. This fiscal dominance, characterised by deregulation and steeper yield curves, invites private credit inflows and sustains nominal liquidity growth, though at a pace that may not fuel rapid asset appreciation. Consequently, the cycle appears poised for prolongation into 2026, with risks of transient inflationary pressures from broad-based spending, necessitating a focus on forward-looking data to anticipate policy pivots.
Deep dive on the Bitcoin Cycle
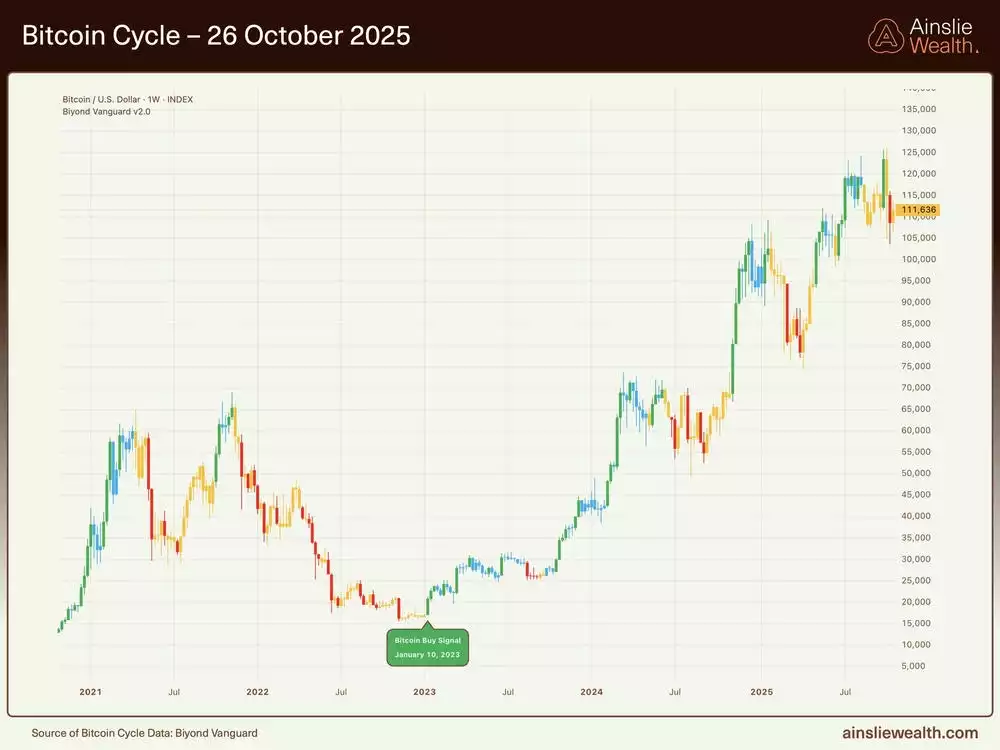
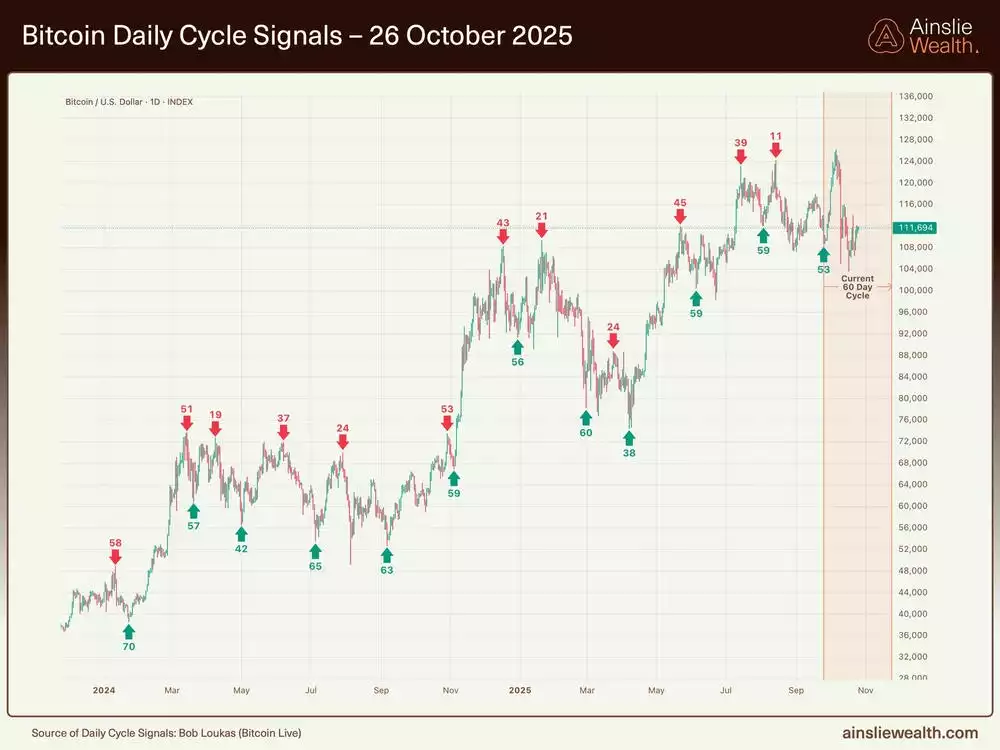
Bitcoin's performance remains tightly correlated to global liquidity, with recent divergences from nominal highs expected to resolve upward as rate-of-change stabilises, particularly amid projected bank reserve increases and year-end fiscal flows that could propel prices toward fair value alignment. Cycle analysis reveals choppy 60-day patterns, potentially right-translated for a late-year rally, following an explosive early move and historic liquidation events that underscore leverage risks in a maturing environment. While bearish momentum signals have been overlooked in favour of macro continuity, the asset's sensitivity to liquidity slowdowns highlights caution near cycle peaks, with opportunities for accumulation during consolidations. This configuration favours strategic positioning for potential upside into early next year, balanced against volatility from external factors like US dollar strength or repo market stresses.


Gold and Silver
We can take advantage of the Macro Cycles by strategically allocating between the Macro Assets (Bitcoin, Gold, and Silver) during the optimal cycle stages.
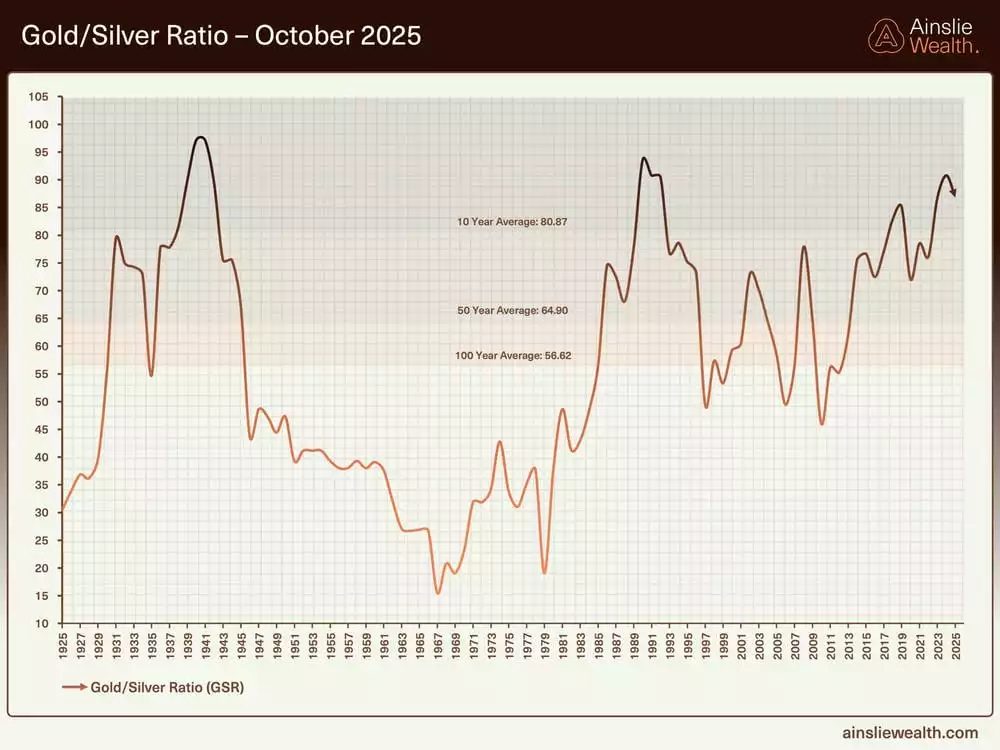
Strategic allocation among macro assets benefits from cycle positioning, with gold and silver capitalising on the debasement trade through record demand and vertical price surges, followed by healthy pullbacks that preserve upward trajectories amid fiscal dominance. Silver has outperformed in percentage terms, driven by industrial demand, supply squeezes, and elevated leasing rates, resulting in extreme backwardation and ETF halts, while the gold-to-silver ratio's compression from the low 90s to mid-80s signals further potential for silver gains in a liquidity-expansive phase. Over longer horizons, silver's amplified sensitivity positions it for extended outperformance, particularly as the ratio retains room to decline toward historical lows before any macro peak reversal. This dynamic aligns with liquidity trends, favouring silver in the near term as a high-beta play within the precious metals complex.

A Simple Trading Plan to take advantage of the cycles
Watch the video presentation to see full details of the specific Trading Plan we provide, which you can follow, that has returned 202.4% p.a. as at Tuesday’s recording.
Watch the full presentation with detailed explanations and discussion on our YouTube Channel here:
We will return in November to assess what has changed and keep you updated with everything you need to know. Until then, good luck in the markets!
Chris Tipper
Chief Economist and Strategist
The Ainslie Group
x.com/TipperAnalytics
Note: The monthly video presentation is recorded live with our expert panel. Our objective is to make the updates as useful and specific to what you want to understand as possible, so as always feel free to reach out with any questions or feedback that we can incorporate into next month’s video to make it something that provides you with the highest possible value for your time!