Macro and Global Liquidity Analysis: Gold, Silver, and Bitcoin – March 2025
News
|
Posted 28/03/2025
|
9351
Today the Ainslie Research team brings you the latest monthly update on where we are in the Global Macro Cycle, driven by the Global Liquidity Cycle, and the implications for Gold, Silver, and Bitcoin. This summary highlights the key charts discussed with our expert panel on Wednesday. We encourage you to watch the recorded video of the presentation in full for the detailed explanations.
Where are we currently in the cycles?
In our latest discussion, we focused on clarifying current market conditions by examining key cycle indicators. The global liquidity cycle is trending upwards, signalling increasing liquidity, which generally supports asset prices. Simultaneously, the global macro cycle is positioned in a mid-cycle phase, suggesting ongoing economic expansion, but without the exuberance typically seen later in the cycle. However, the Bitcoin cycle remains classified in a short-term bear market, despite a recent bounce from lows around the US$80,000 mark back up to approximately US$87,000. Pullbacks of around 30% are relatively common even during prolonged bull markets, indicating that the recent moves could simply be a temporary pause before the broader bull market resumes. The ambiguity is further amplified, however, by mixed signals from the macro indicators, which have alternated between early and mid-cycle conditions. This uncertain environment underscores the importance of a cautious approach. For now, market participants should remain vigilant and flexible to take advantage of a shifting landscape.


Deep dive on the Global Liquidity Cycle
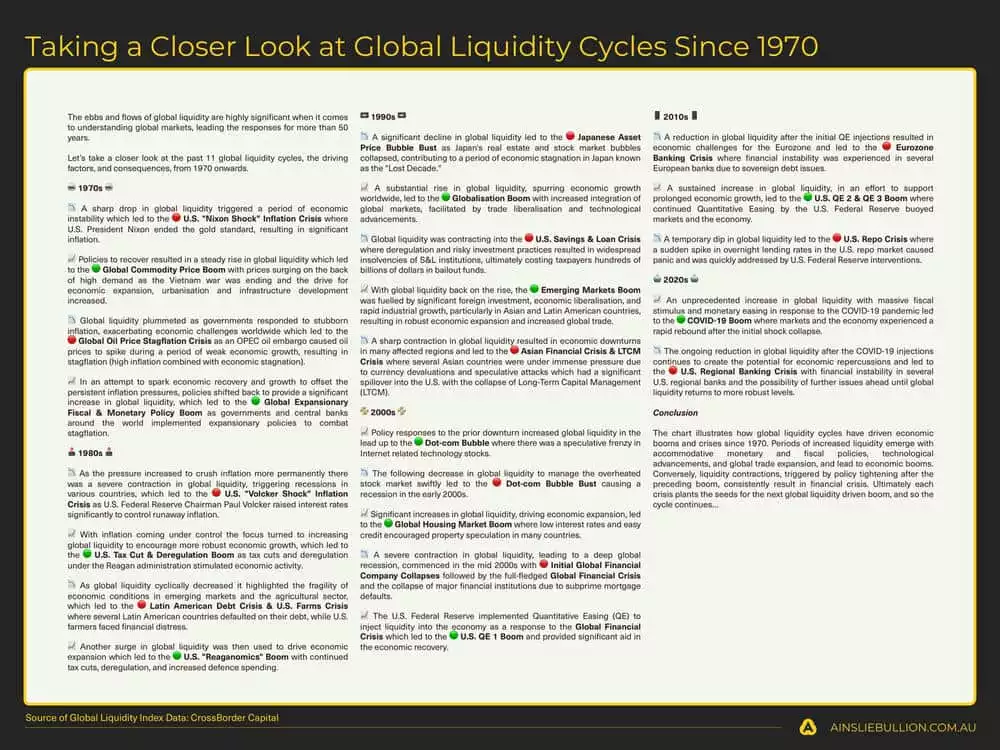
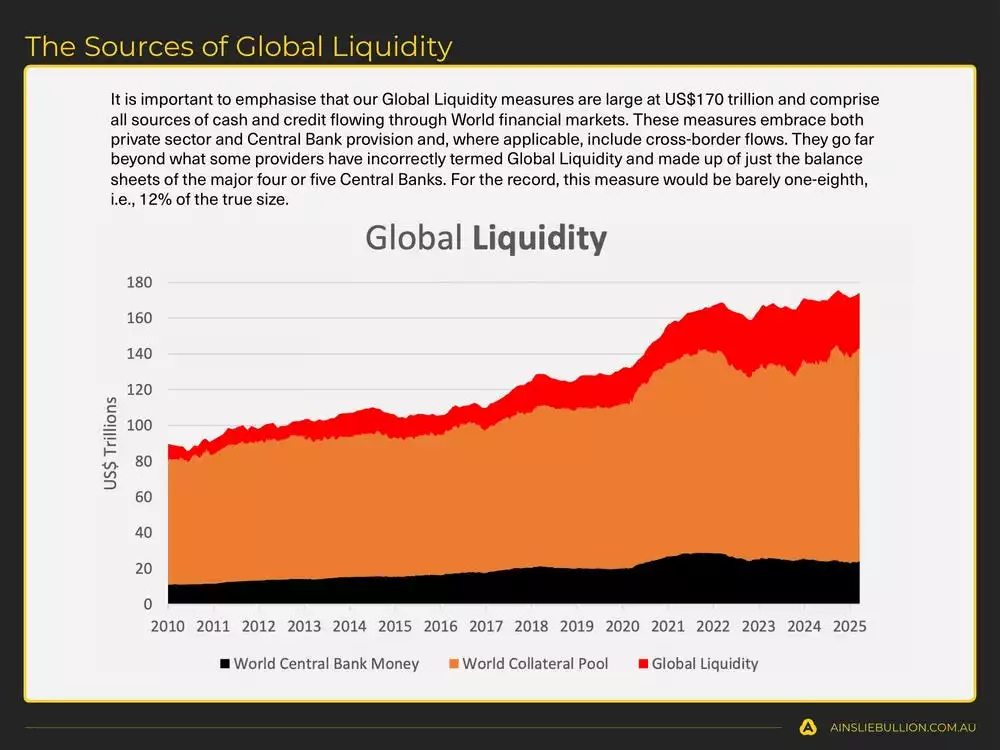
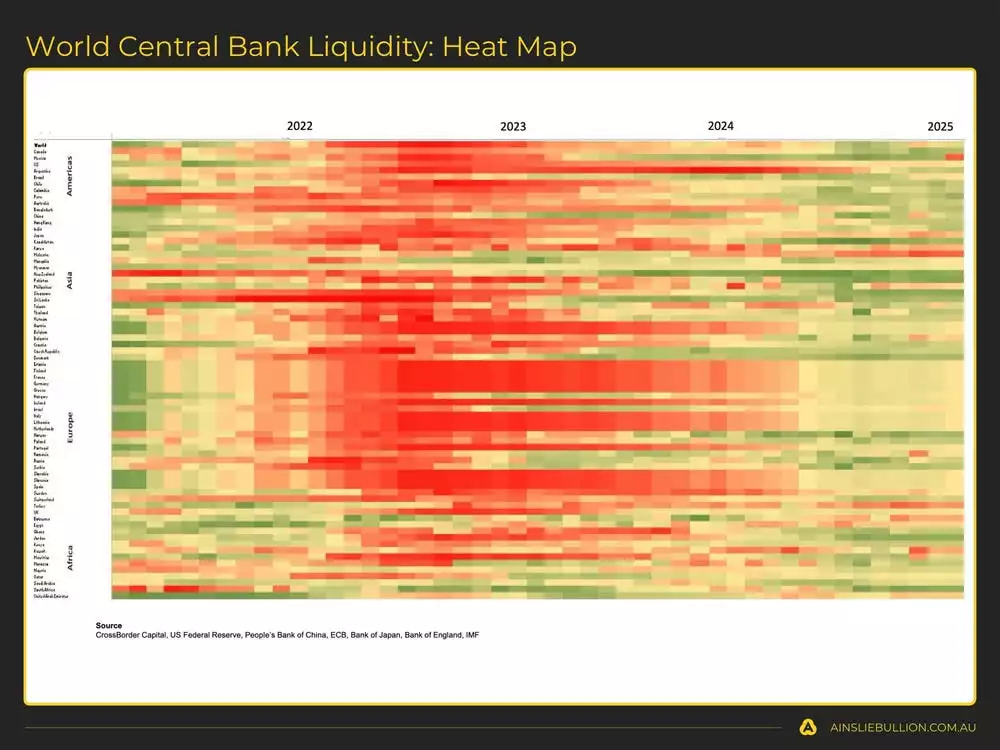
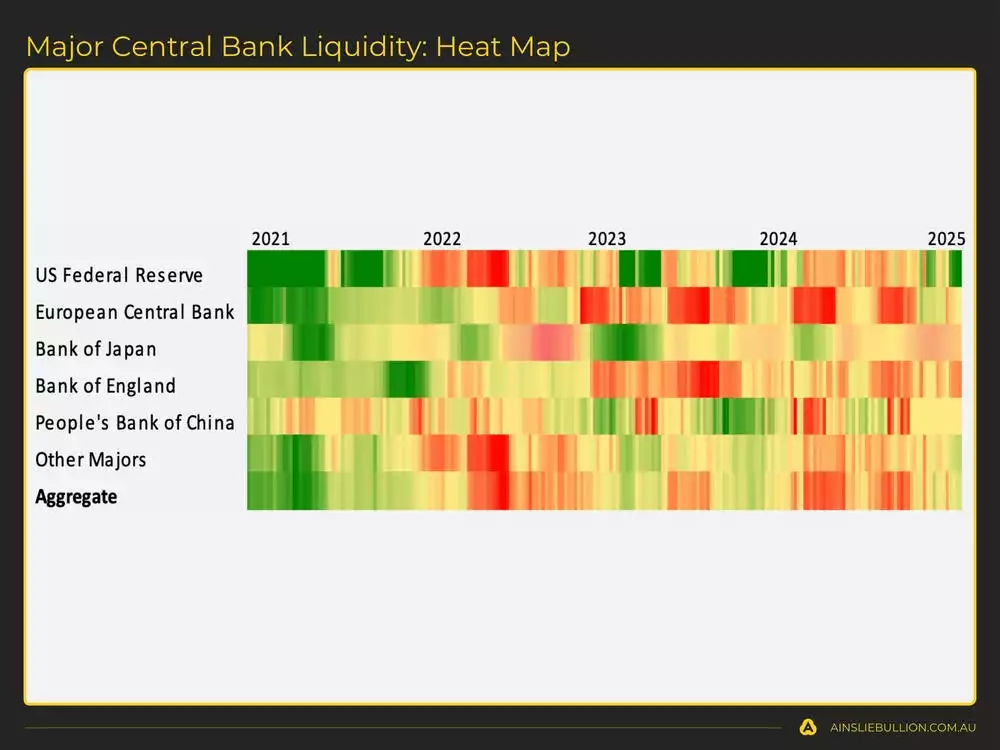
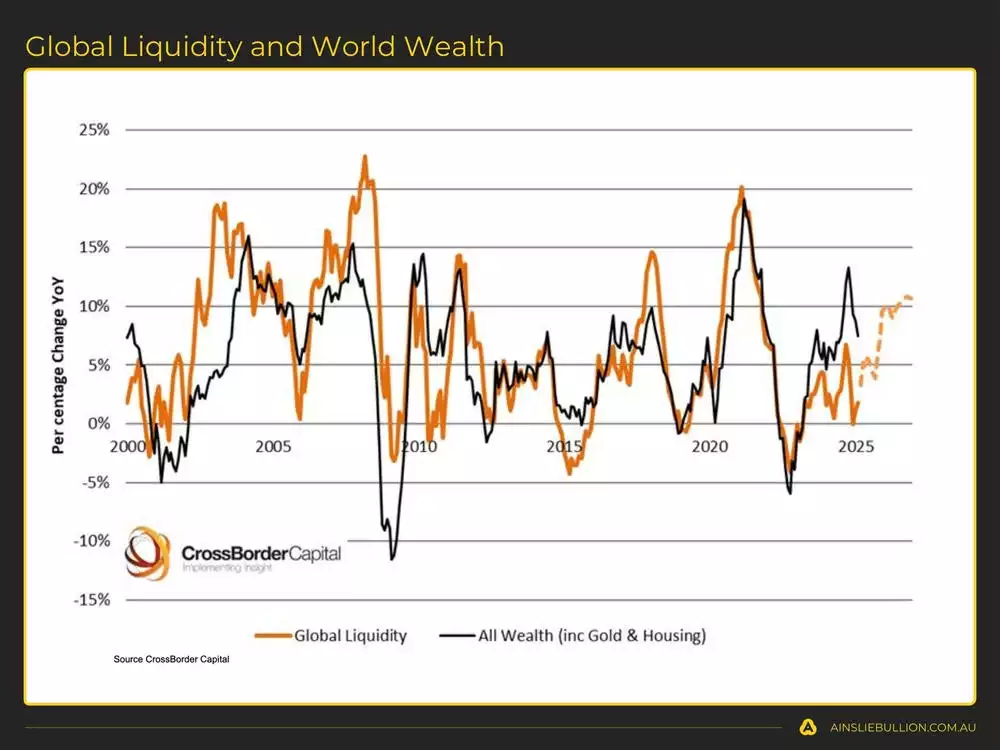
The current state of global liquidity highlights why having a clear analytical framework is essential. Historically, global liquidity cycles follow a predictable pattern, with periods of increasing liquidity typically leading to asset booms and phases of decreasing liquidity resulting in financial crises. While recent indicators confirm we've been in an upward liquidity phase, this trend has recently stalled. The reluctance of central banks to aggressively inject liquidity, given the persistent inflationary pressures following massive stimulus during COVID-19, has led to a more hesitant and uneven trajectory in liquidity growth. Current data reflects this hesitancy, with the Global Liquidity Index indicating a moderate uptick but still significantly below previous highs, leaving markets in a cautious holding pattern. The major central banks, especially the U.S. Federal Reserve, have yet to substantially boost liquidity, providing only limited and largely technical support thus far. As a result, the recent bounce in global liquidity, driven partly by short-term factors like a falling U.S. dollar and the drawdown of the Treasury General Account (TGA), is viewed with caution. Without more sustained and robust support from central banks, particularly as liquidity conditions tighten heading into tax season, the recovery in risk assets remains fragile and vulnerable to volatility.



Deep dive on the Global Macro Cycle
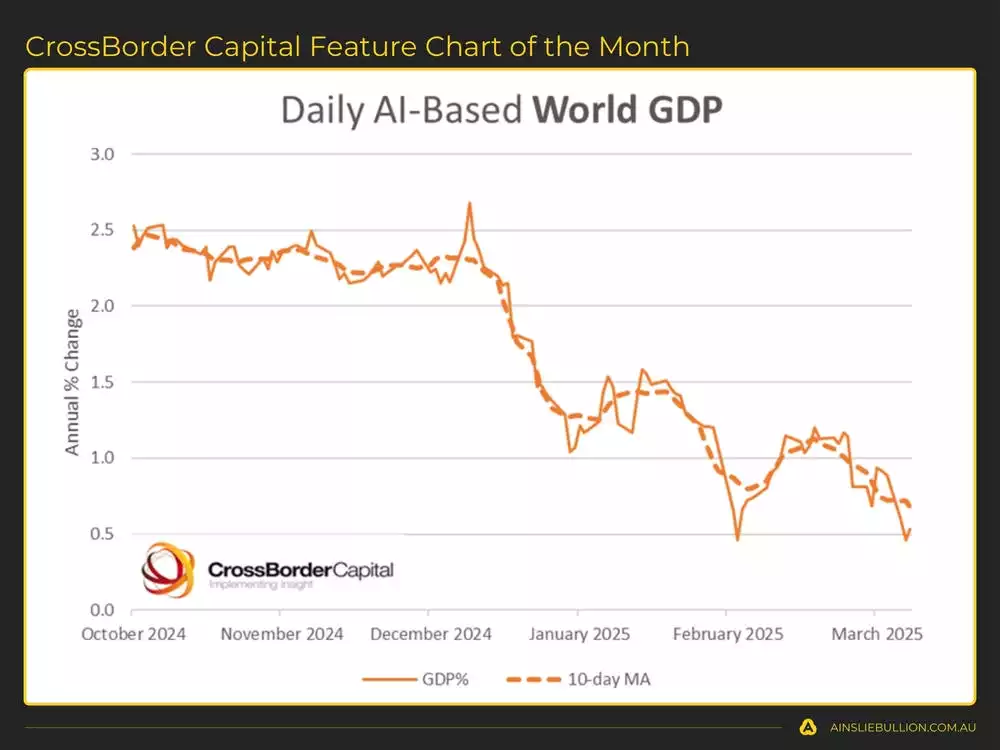
The current macroeconomic indicators further emphasise the complexity of the market environment. Recent data from U.S. manufacturing and services PMIs indicate a slowdown in economic momentum, aligning with the broader decline seen in global GDP growth, which now approaches critical lows. This reflects intentional policy tightening aimed at controlling yields and inflation but raises concerns about how swiftly growth can recover once policy constraints ease. Despite a notable reduction in headline inflation, underlying risks persist, particularly as new tariffs take effect, potentially reigniting inflationary pressures. Simultaneously, U.S. Treasury yields remain stubbornly high, indicating limited investor flight to safety during recent market turbulence—possibly due to shifts in global purchasing preferences, such as increased sovereign demand for gold. The trajectory of the U.S. dollar also remains pivotal; its recent decline has provided temporary relief for global liquidity conditions. However, with signs pointing to a possible rebound, renewed dollar strength could again challenge risk assets, underscoring the delicate balance central banks and policymakers must maintain to stabilise markets without stifling growth.




Deep dive on the Bitcoin Cycle
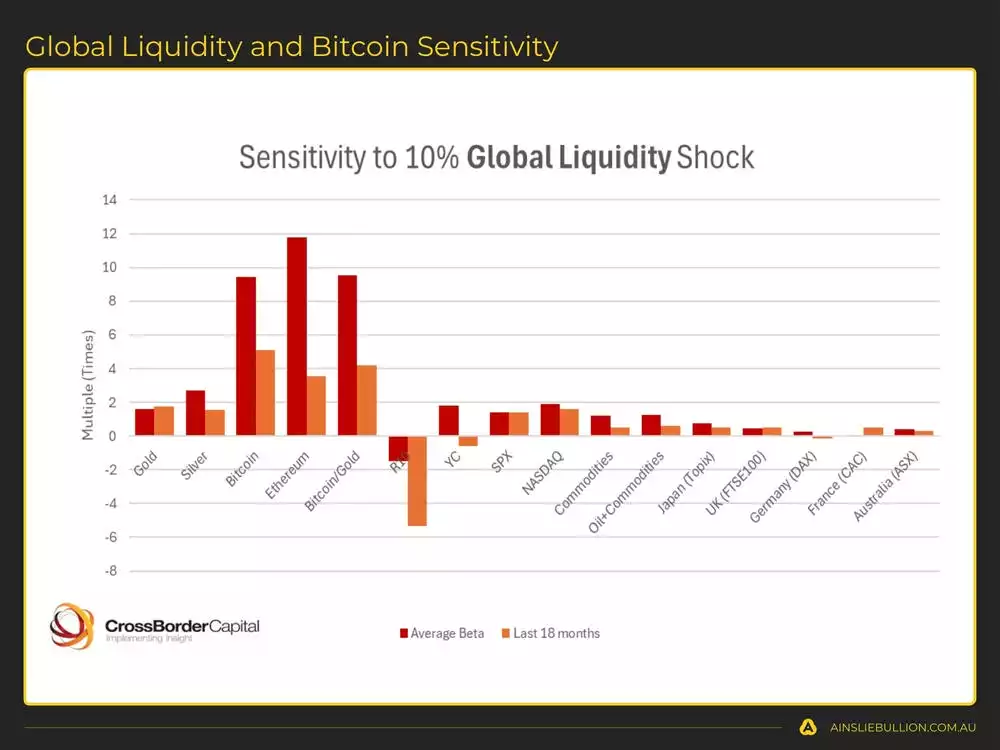
When looking at the relationship between global liquidity and overall asset valuations, our focus always lands back on Bitcoin due to its pronounced sensitivity to changes in liquidity. Historically, Bitcoin has shown approximately a tenfold return for every 10% rise in global liquidity, although this sensitivity has moderated to roughly fivefold over the past 18 months as its market capitalisation has expanded. Other monetary inflation hedges such as gold and silver have also been responsive to liquidity fluctuations, reinforcing their role as valuable but comparatively more stable assets. Currently, although global liquidity trends indicate the potential for an improving outlook for Bitcoin, caution is advised due to volatility anticipated around mid-April, tied to seasonal liquidity pressures from tax obligations. Furthermore, unresolved speculative positions around key Bitcoin support levels between US$83,000 and US$85,000, and lower clusters into the US$70,000s suggest the possibility of short-term market turbulence, even within an overall positive longer-term trajectory.



Gold and Silver
We can take advantage of the Macro Cycles by strategically allocating between the Macro Assets (Bitcoin, Gold, and Silver) during the optimal cycle stages.
Precious metals have been performing strongly, with gold benefiting significantly from increased central bank purchases amid global geopolitical uncertainty, as institutions shift away from U.S. Treasuries. Silver, typically seen as an industrial and monetary metal, has resisted selloffs despite recent economic turbulence, underscoring its appeal as a monetary asset. With the gold-to-silver ratio currently elevated around historically high levels, silver presents a particularly compelling investment opportunity, potentially offering considerable upside as the cycle progresses.


A Simple Trading Plan to take advantage of the cycles
Watch the video presentation to see full details of the specific Trading Plan we provide, that you can follow, which has returned 183.6% p.a. as of Tuesday’s recording.
Watch the full presentation with detailed explanations and discussion on our YouTube Channel here:
We will return in April to assess what has changed and keep you updated with everything you need to know. Until then, good luck in the markets!
Chris Tipper
Chief Economist and Strategist
The Ainslie Group
x.com/TipperAnalytics
Note: The monthly video presentation is recorded live with our expert panel. Our objective is to make the updates as useful and specific to what you want to understand as possible, so as always feel free to reach out with any questions or feedback that we can incorporate into next month’s video to make it something that provides you with the highest possible value for your time!