Macro and Global Liquidity Analysis: Gold, Silver, and Bitcoin – June 2025
News
|
Posted 27/06/2025
|
8944
Today the Ainslie Research team brings you the latest monthly update on where we are in the Global Macro Cycle, driven by the Global Liquidity Cycle, and the implications for Gold, Silver, and Bitcoin. This summary highlights the key charts discussed with our expert panel on Tuesday. We encourage you to watch the recorded video of the presentation in full for the detailed explanations.
Where are we currently in the cycles?
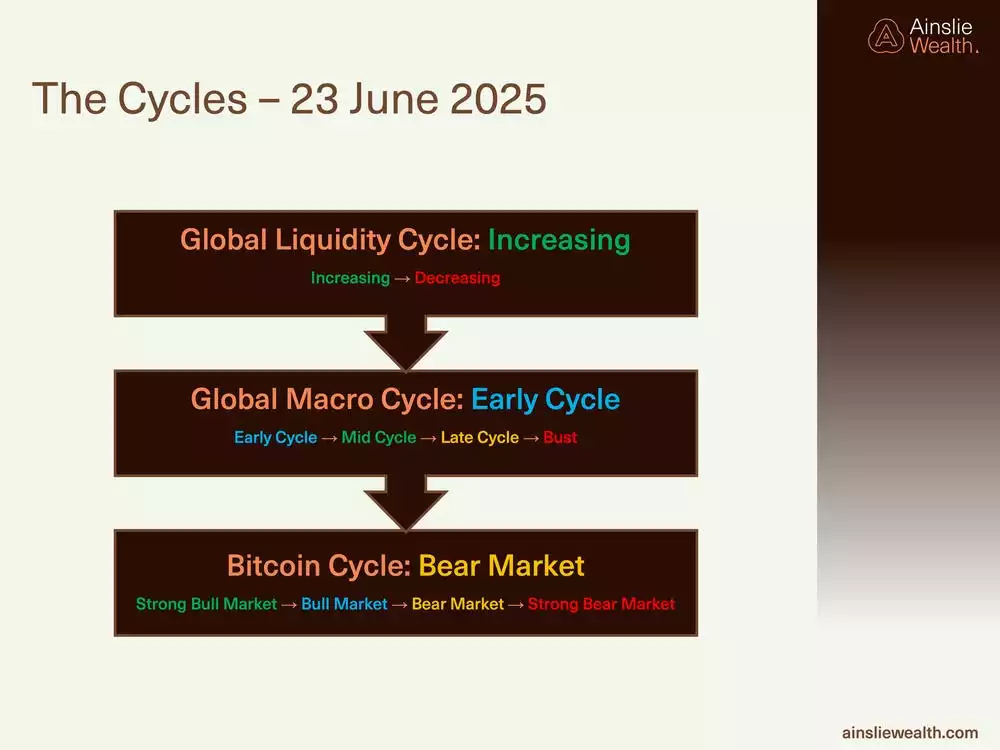
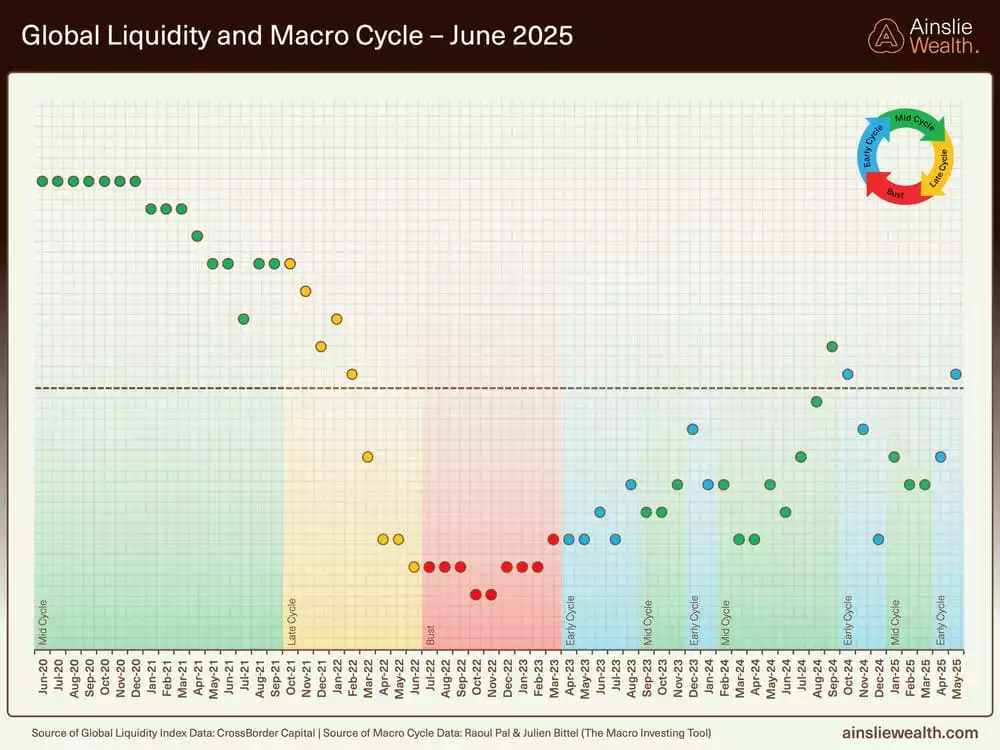
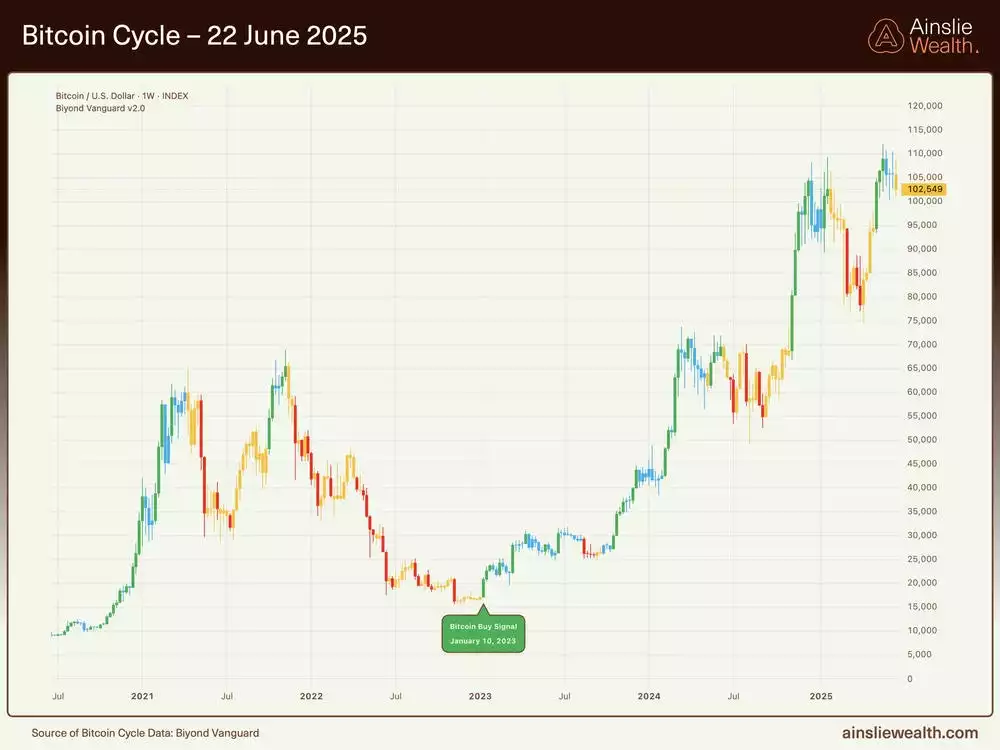
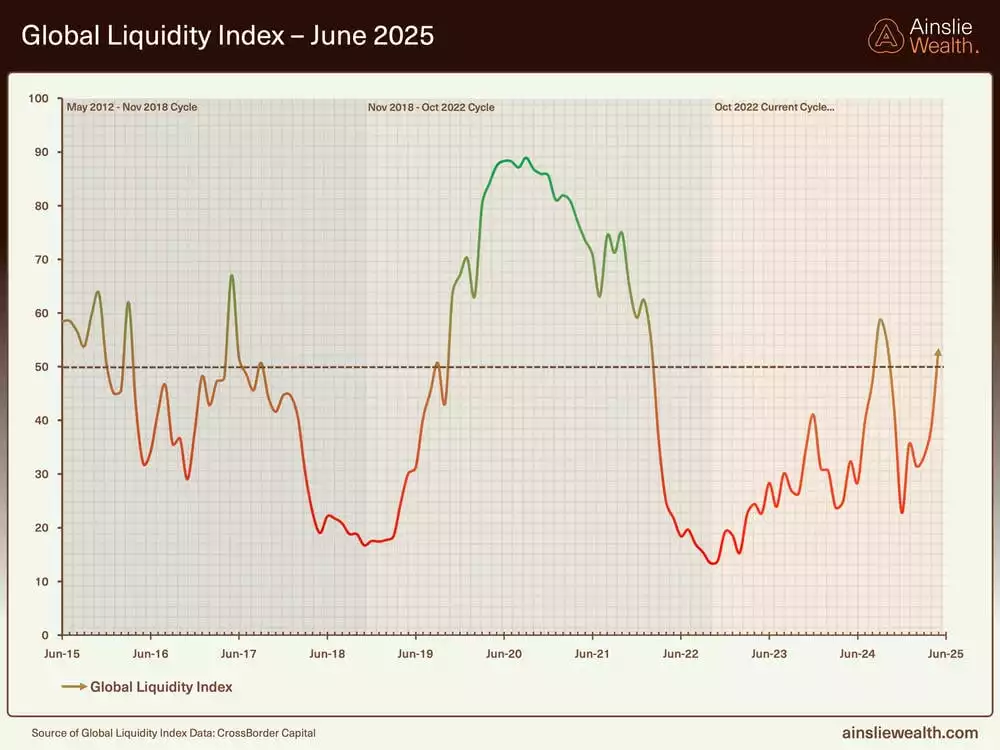
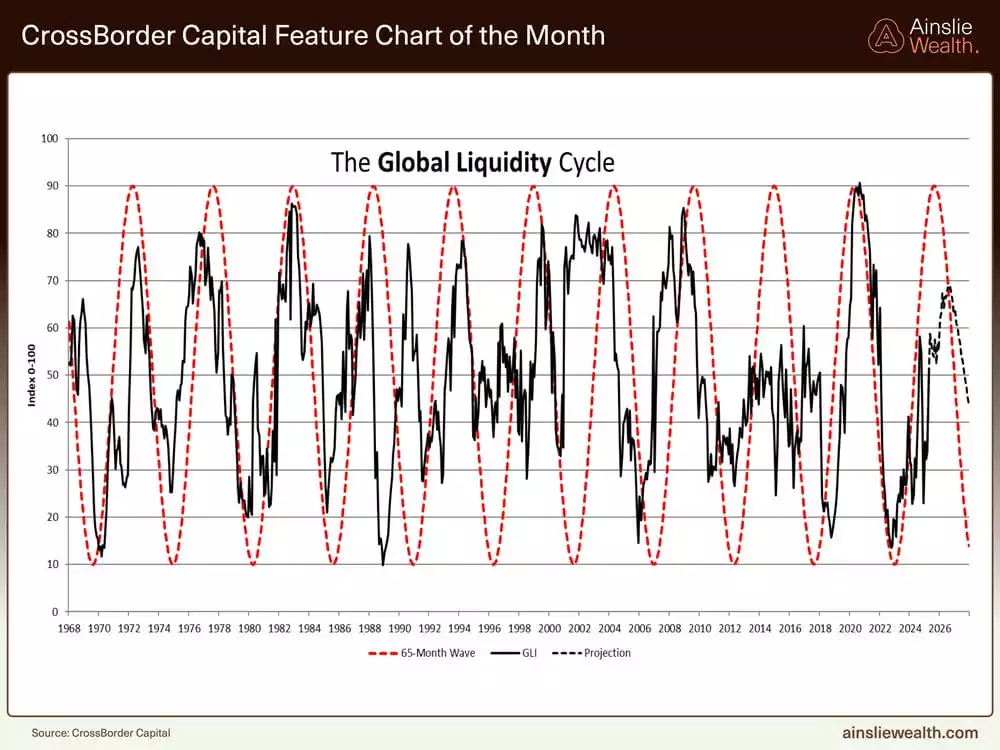
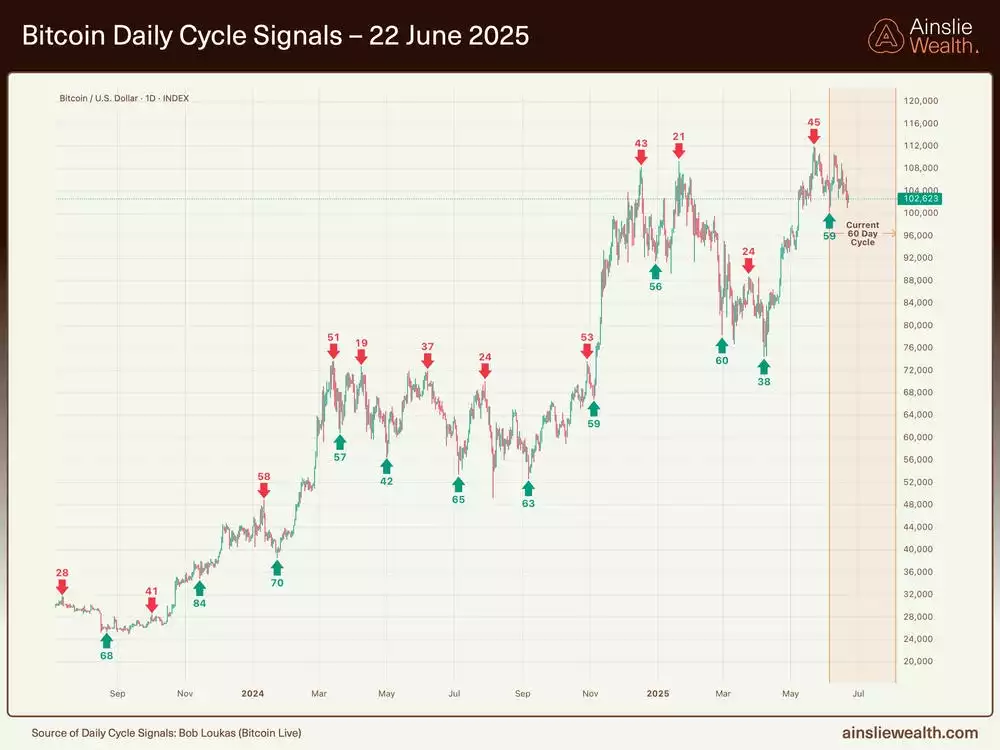
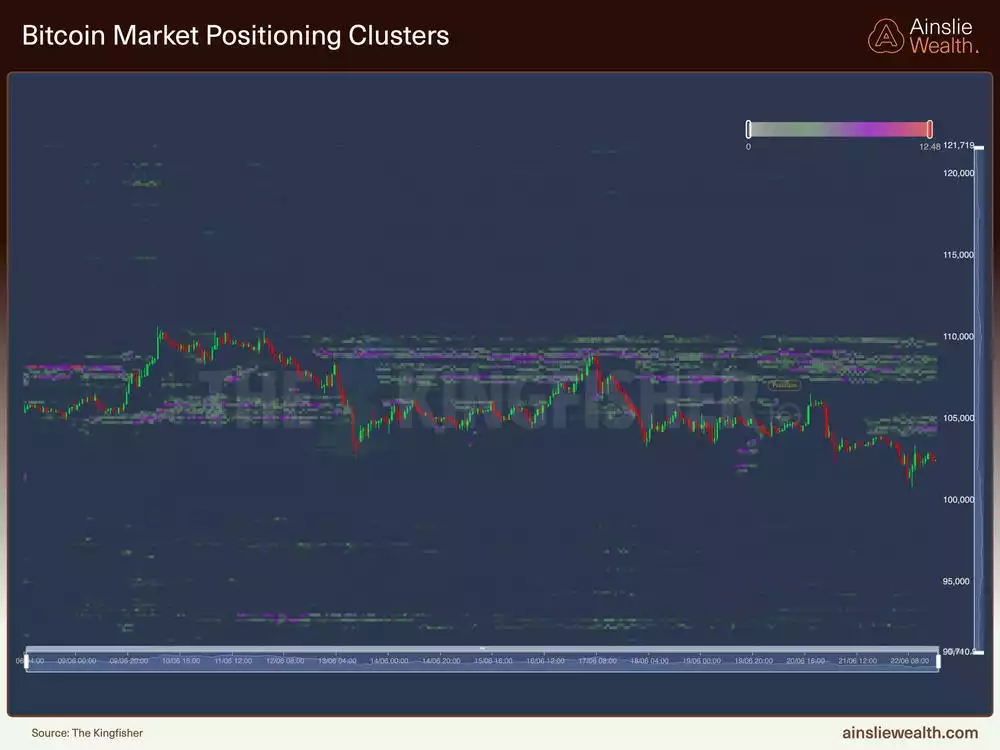
The market remains entrenched in an early to mid-cycle phase, marked by expanding global liquidity and a resilient risk appetite. Despite recent geopolitical turbulence and a bear market signal for Bitcoin—which was dismissed in light of the broader cycle context—the overarching trend continues upward. Services activity has held firm, manufacturing indicators are steadying, and equity indices are looking higher. Bitcoin has swiftly recovered from recent dips, underscoring that the upswing retains momentum. While volatility is inevitable, the cycle appears far from exhausted, offering room for further gains.
Deep dive on the Global Liquidity Cycle
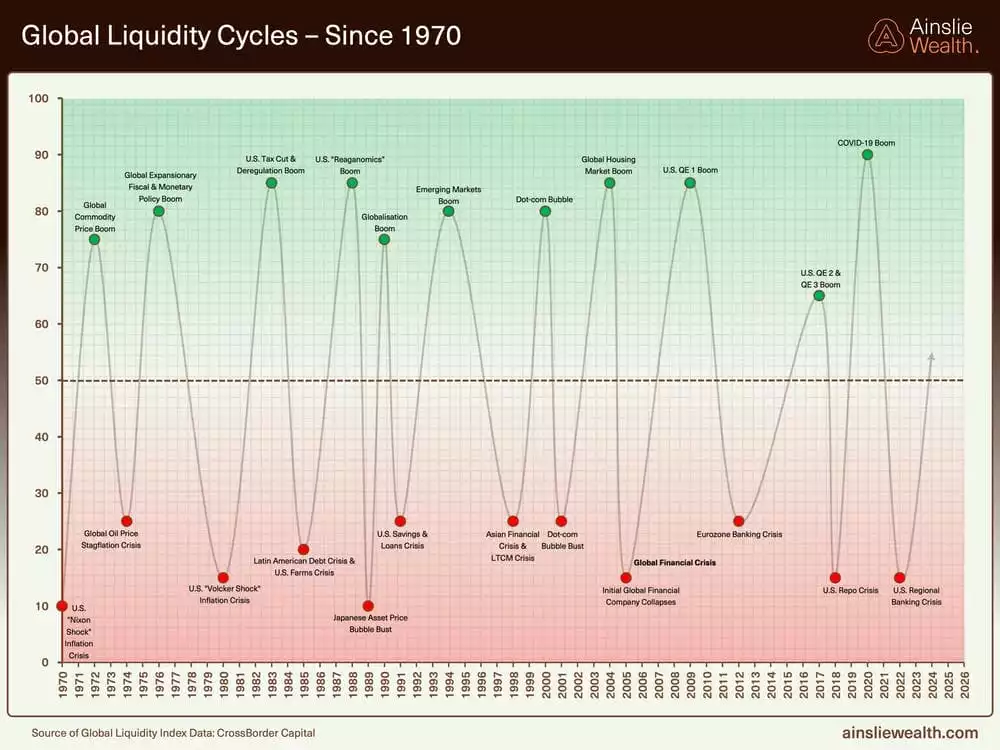
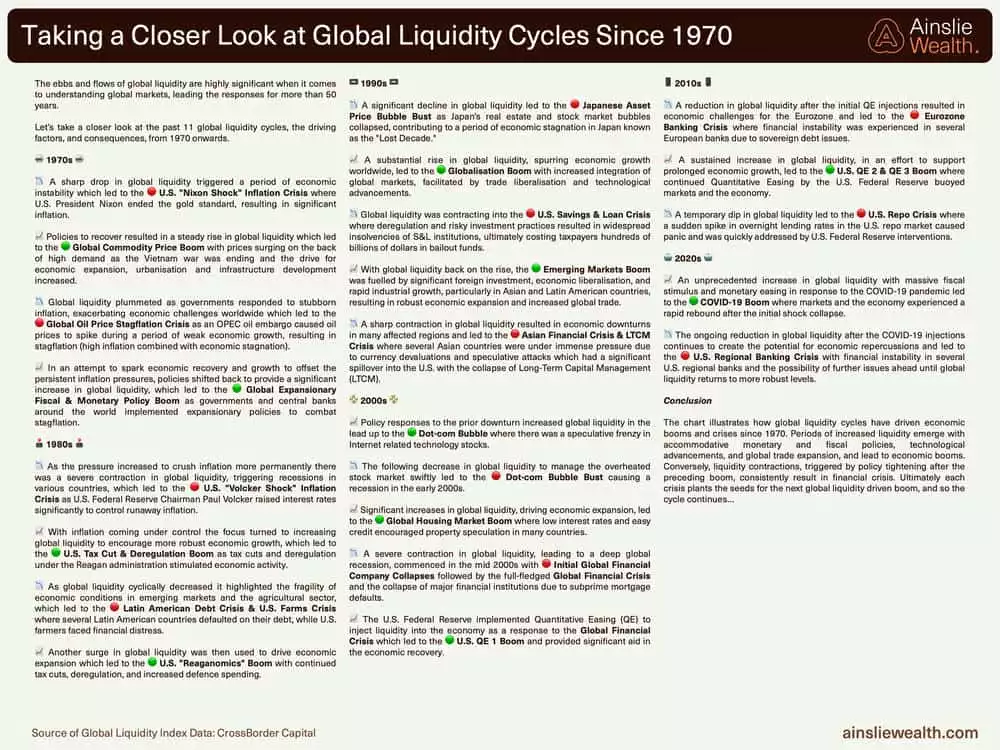
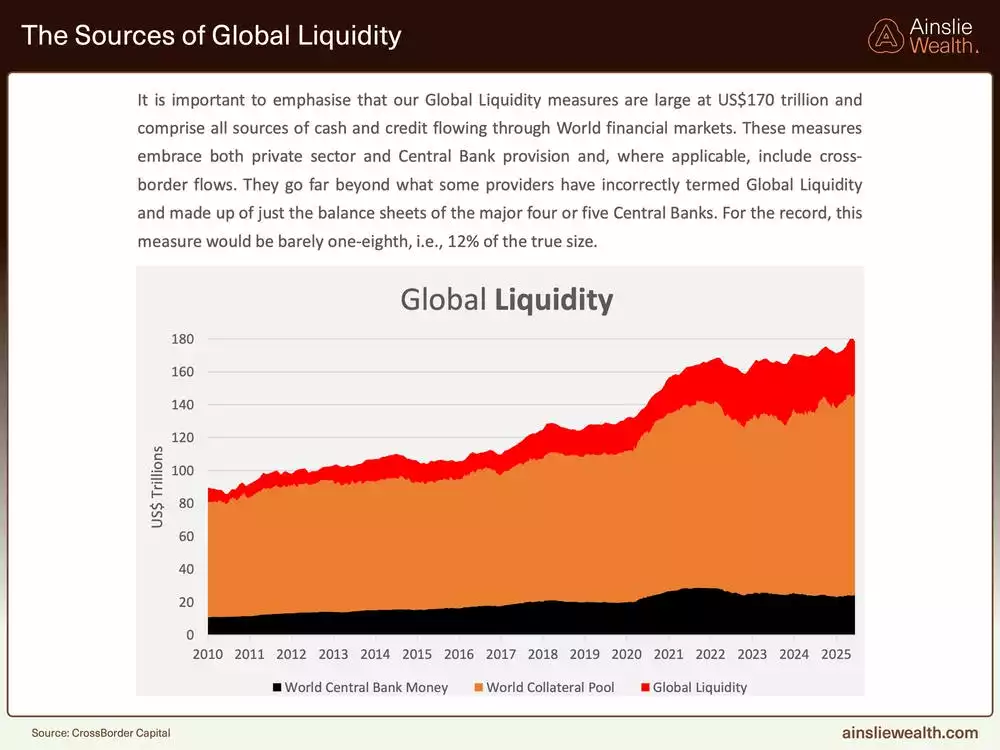
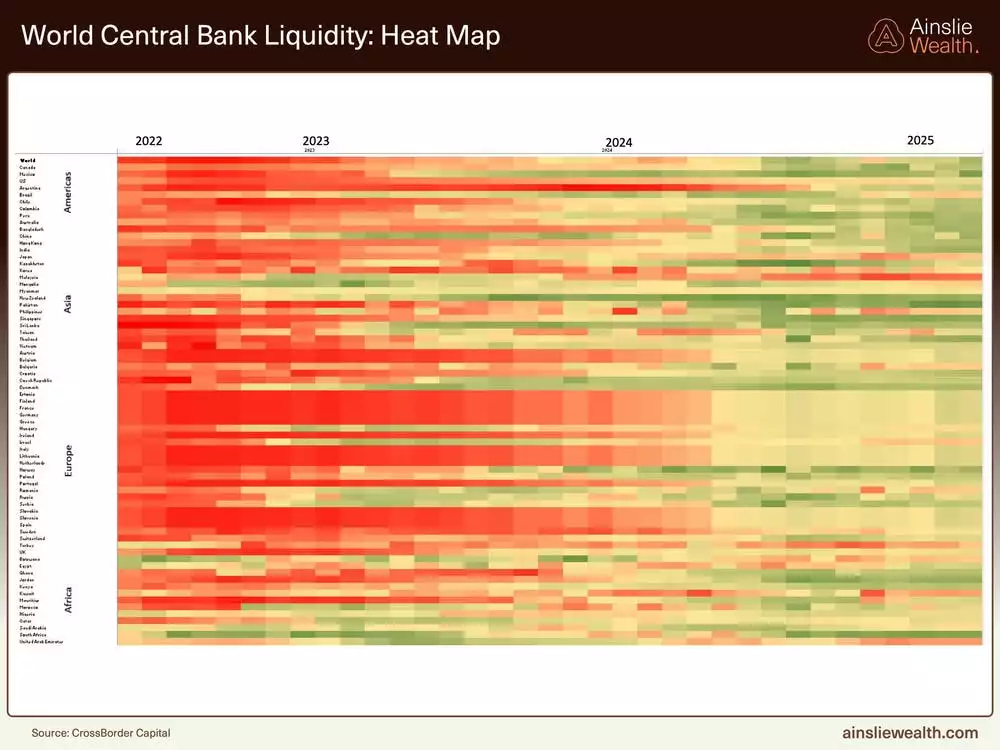
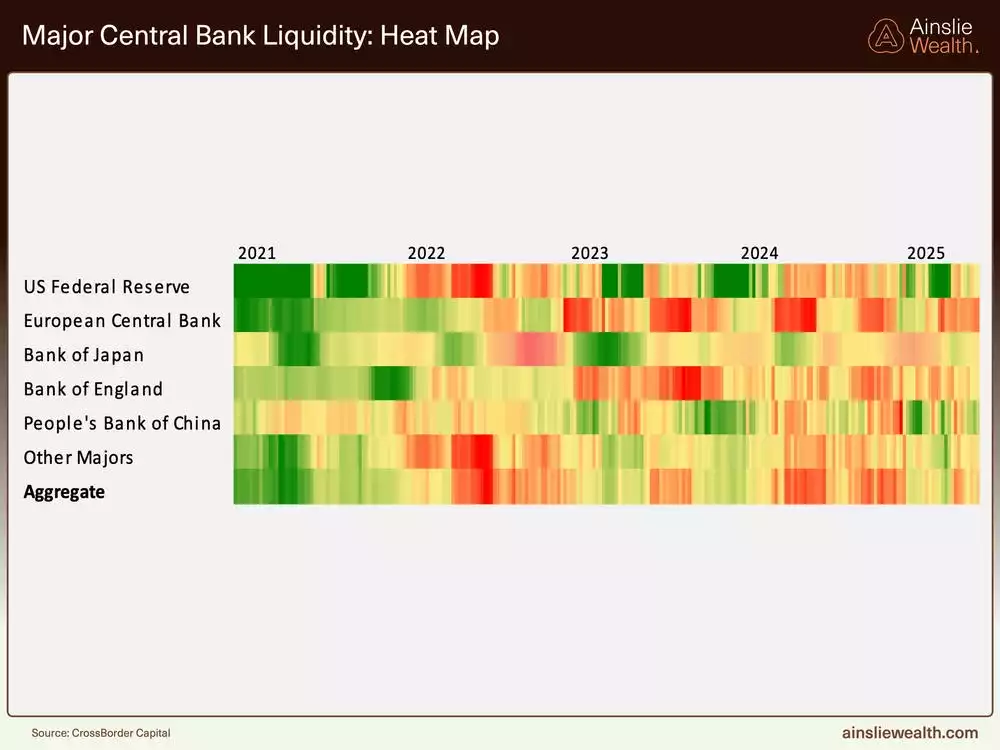
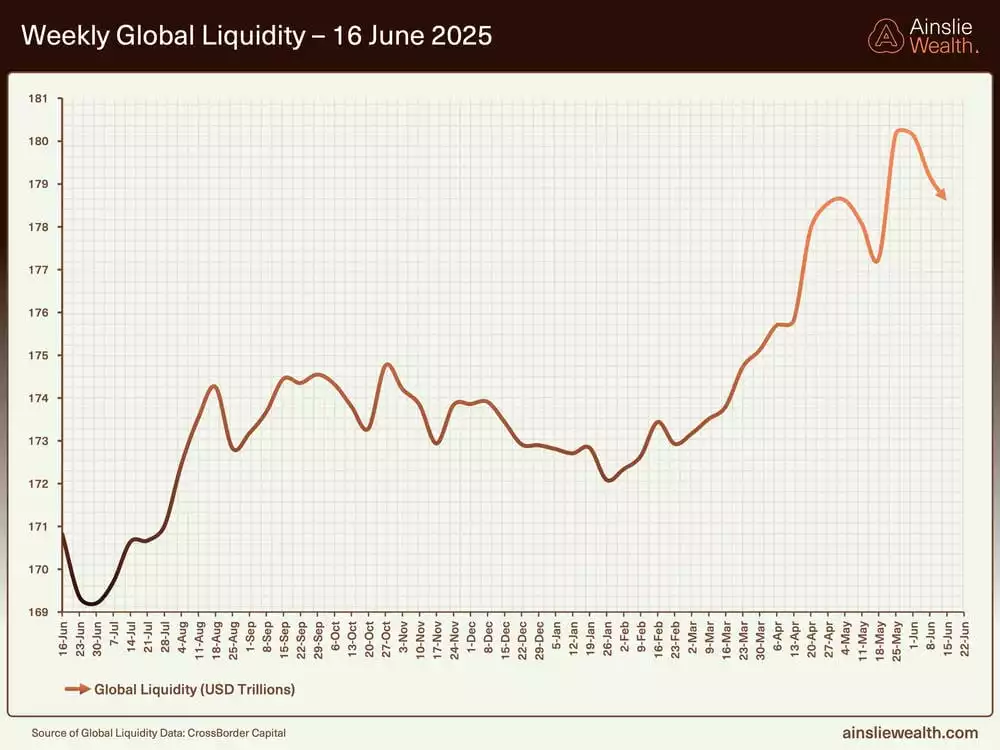
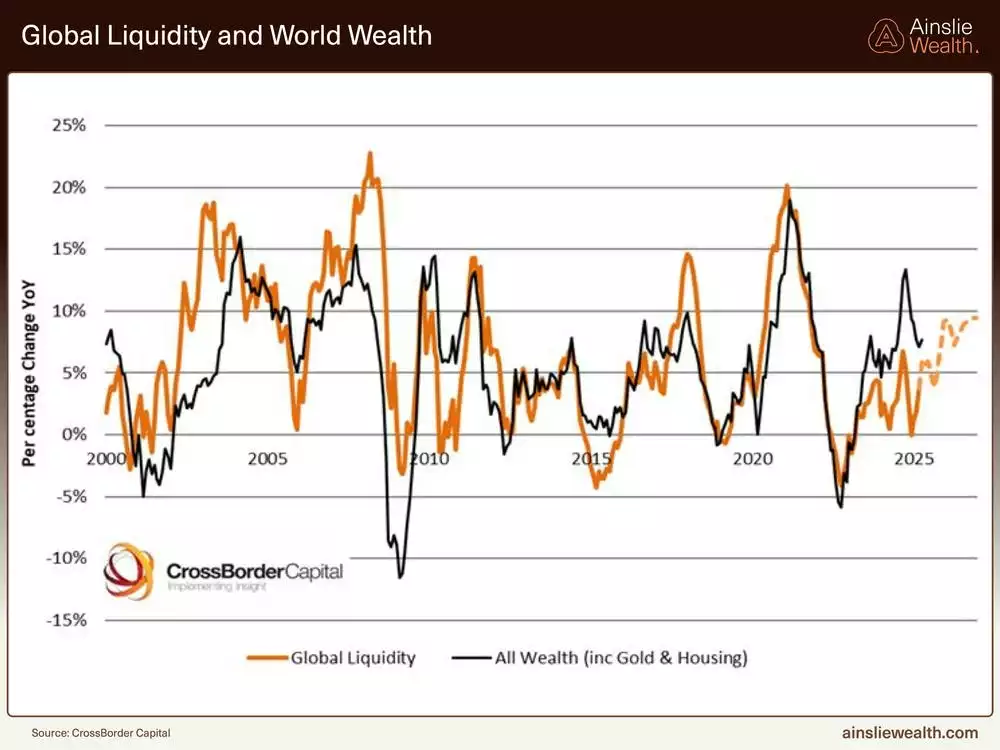
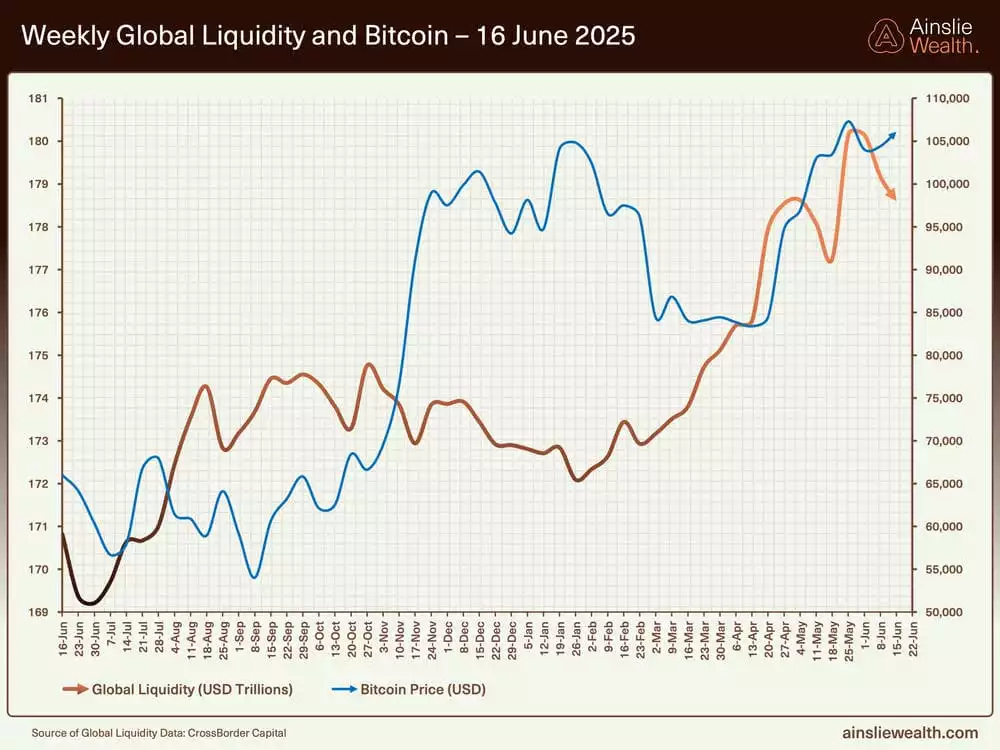
Global liquidity, now approaching US$180 trillion, continues its upward climb despite muted growth in central bank balance sheets. The US Treasury’s drawdown of its General Account and China’s measured easing to combat deflationary pressures have been key drivers. Weekly flows have tapered, yet the broader trend—tracked by momentum, rate of change, and direction—remains expansionary. Anticipated short-term bill issuance to finance US fiscal spending is poised to inject fresh collateral into the system by the September quarter, countering any short-lived liquidity squeezes and sustaining the positive trajectory.
Deep dive on the Global Macro Cycle
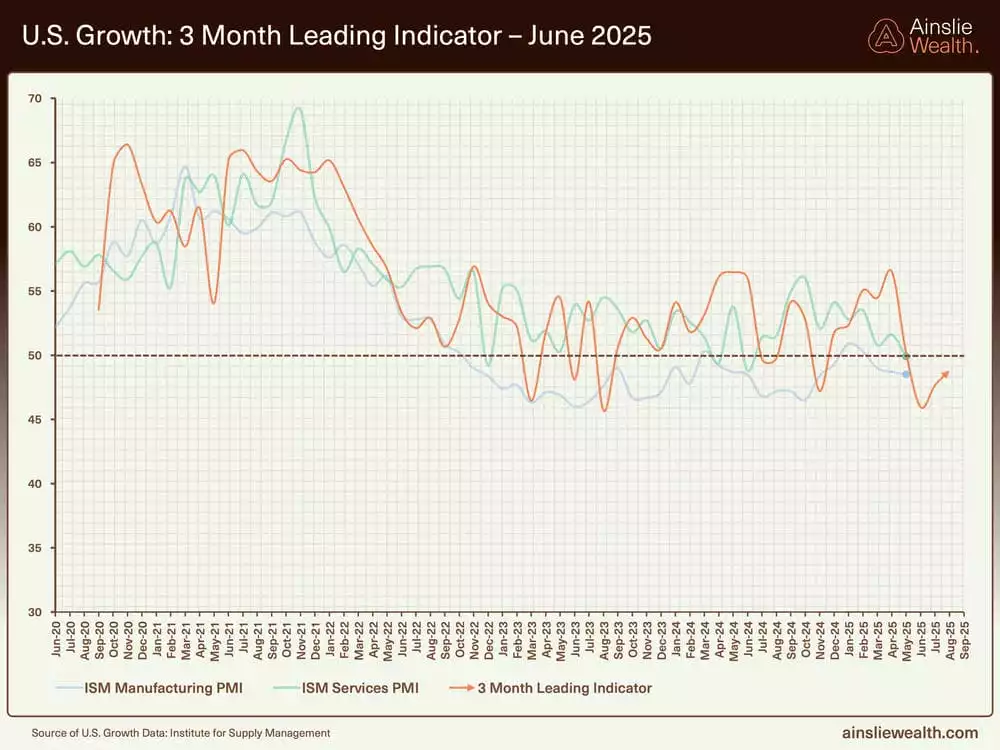
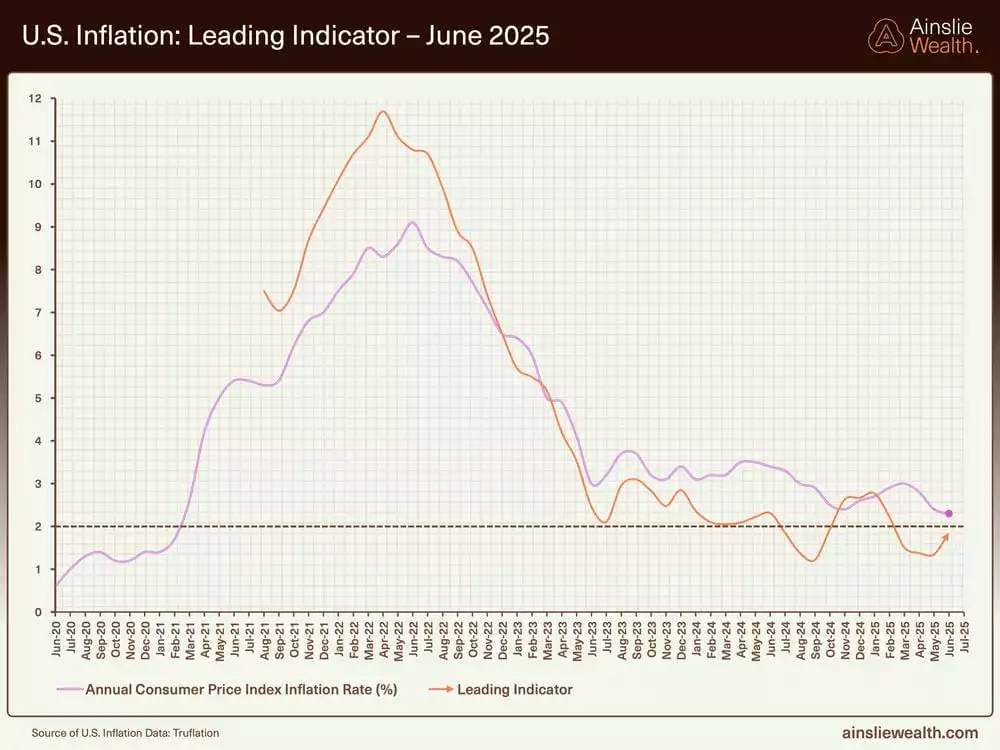
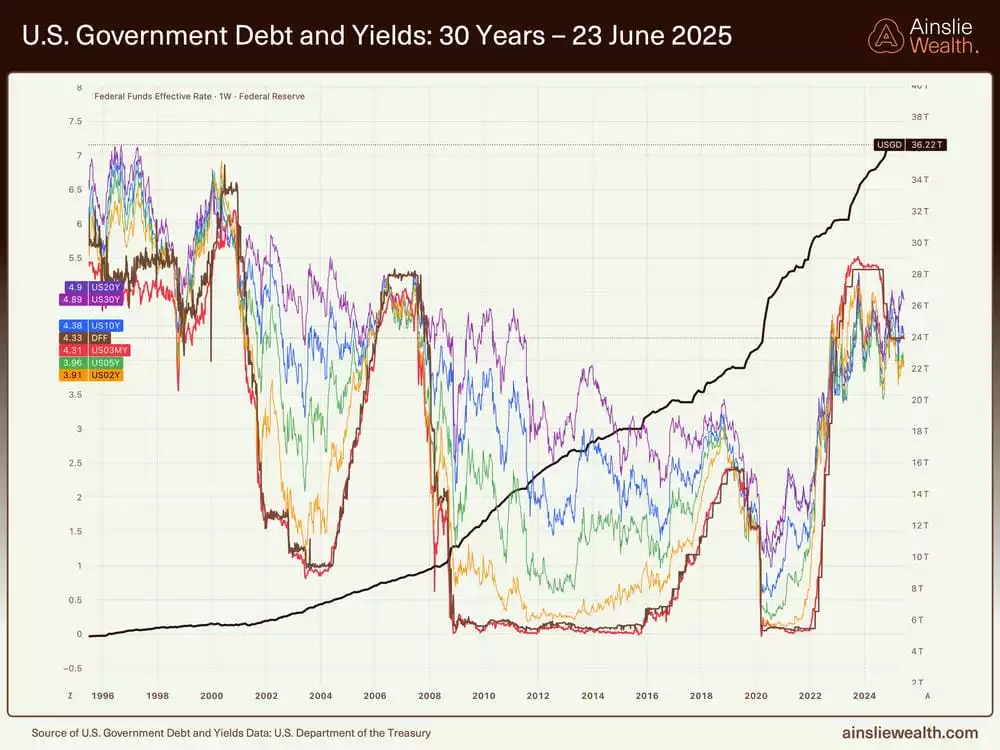
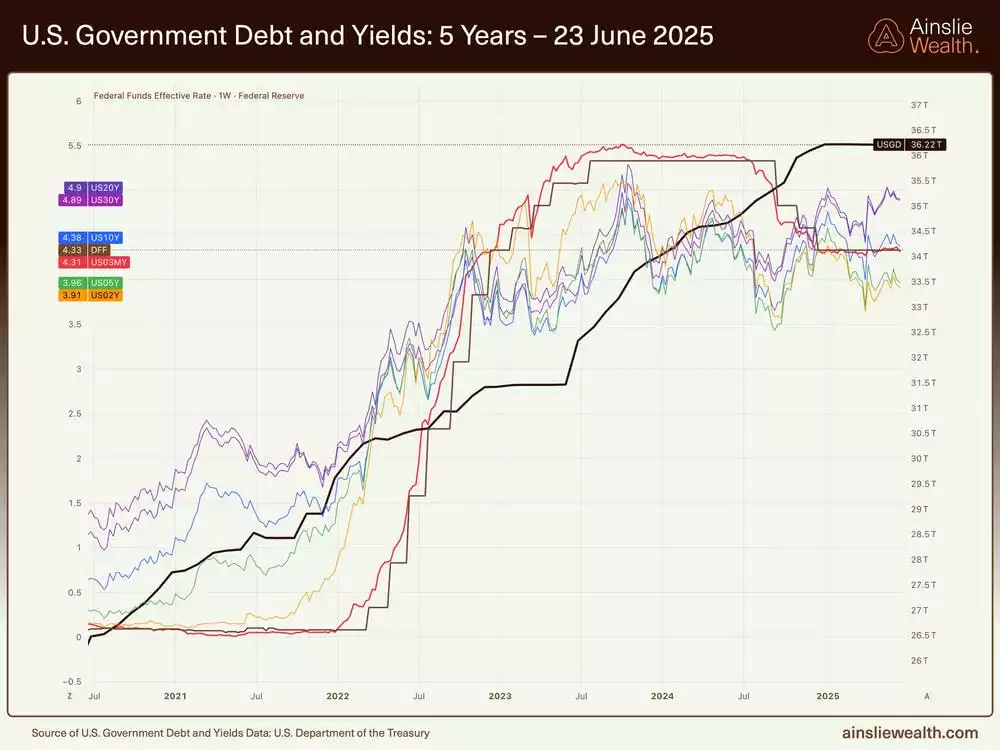
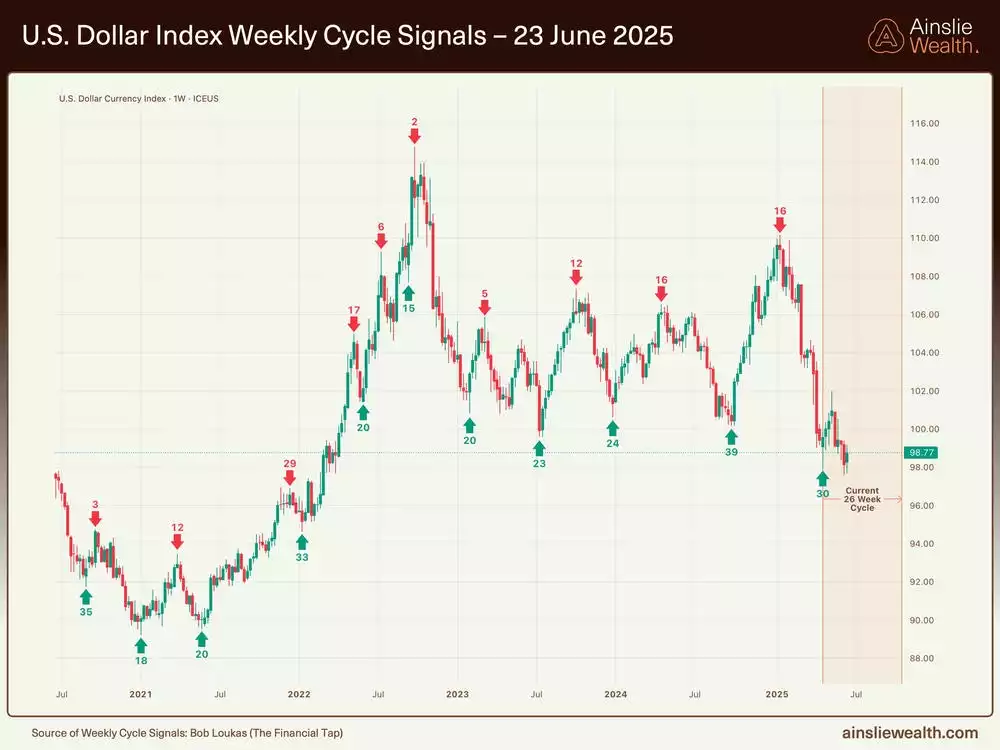
Economic conditions suggest that we may be transitioning from early to mid-cycle dynamics, supported by robust fiscal stimulus and manageable inflation. In the US, a multi-trillion-dollar fiscal package, extending tax incentives and prioritising domestic investment, is fuelling growth prospects. Services surveys consistently exceed 50, manufacturing is ticking upward, and unemployment remains stable. Inflation, having likely found a floor, may rise towards 3–4% as household cash flows strengthen, though growth is expected to keep pace. Sovereign debt looms large—US federal debt is nearing US$37 trillion—keeping bond yields elevated and markets range-bound. A weakening US dollar, testing multi-year lows, could ease global funding pressures and bolster liquidity further.
Deep dive on the Bitcoin Cycle
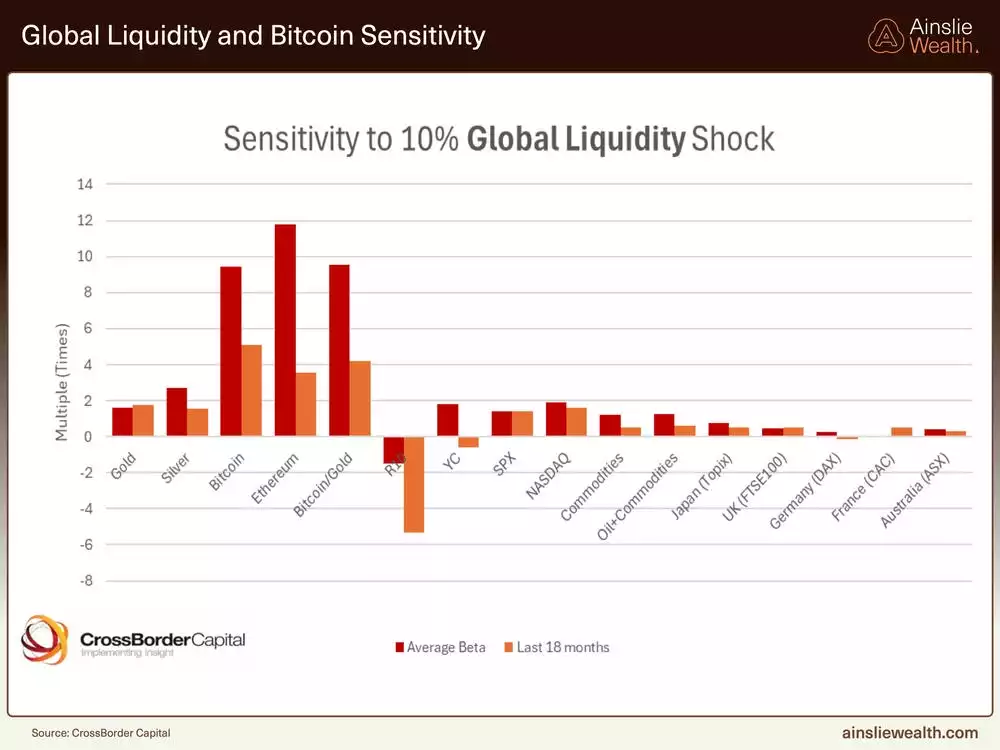
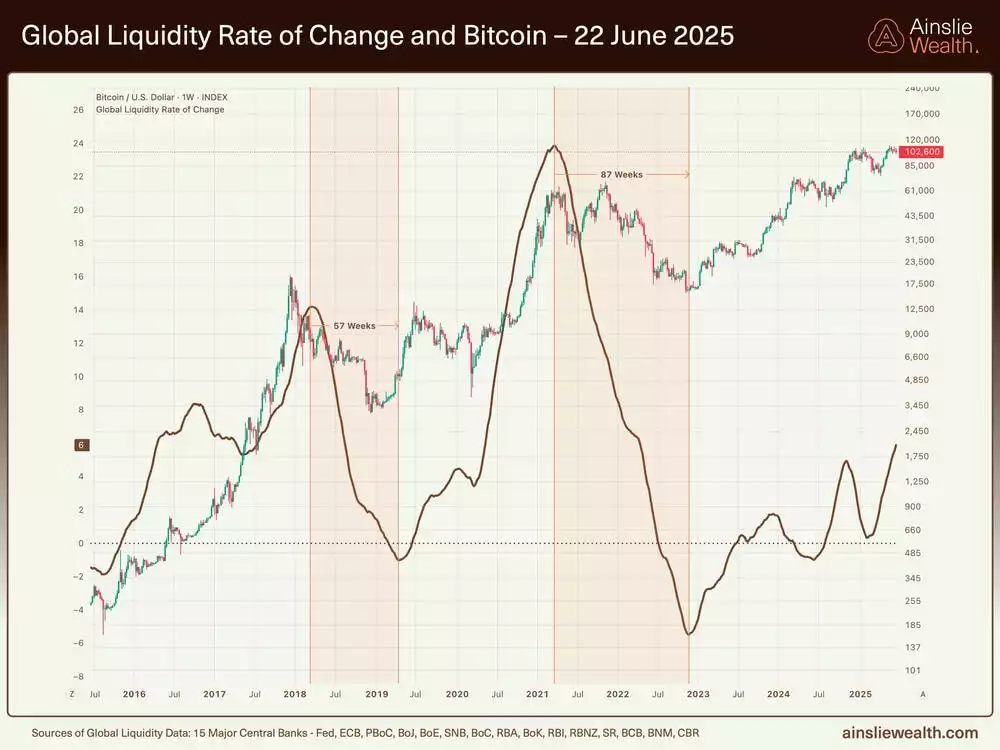
Bitcoin’s sensitivity to liquidity remains unparalleled, with historical data showing a five-to-tenfold response to each percentage point shift in the total level of global liquidity. With liquidity projected to grow through year-end alongside improving macro tailwinds, the cycle points to loftier peaks ahead. For long-term investors, the risk-reward balance favours holding; dips in this phase are viewed as entry points rather than exit signals, with the cycle’s progression—not speculative price targets—guiding decisions.

Gold and Silver
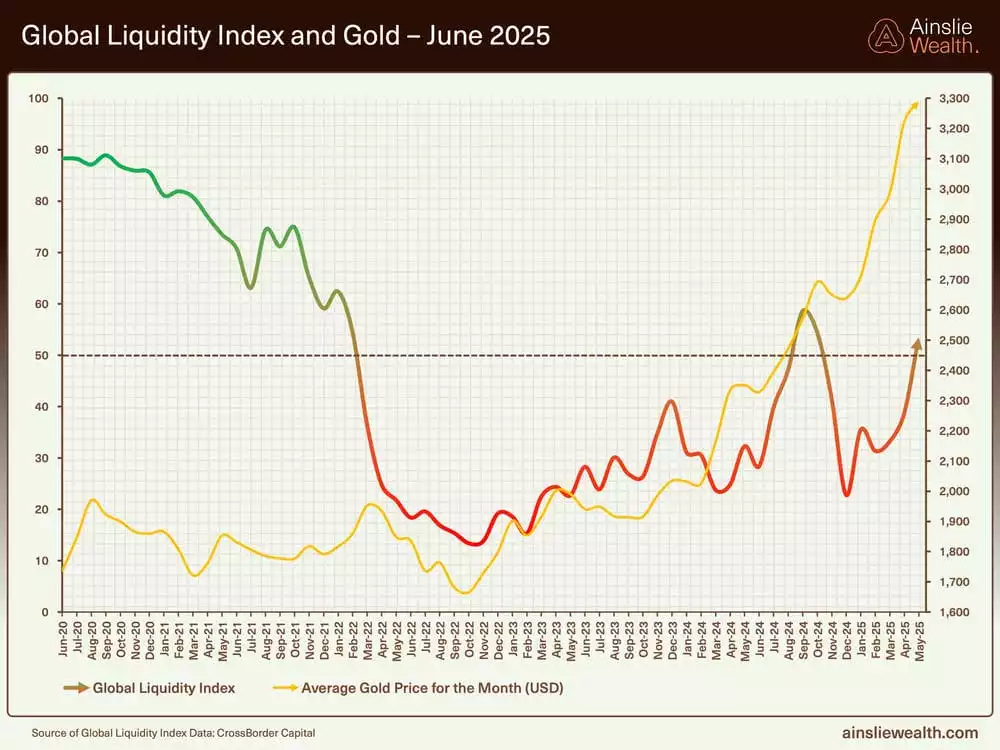
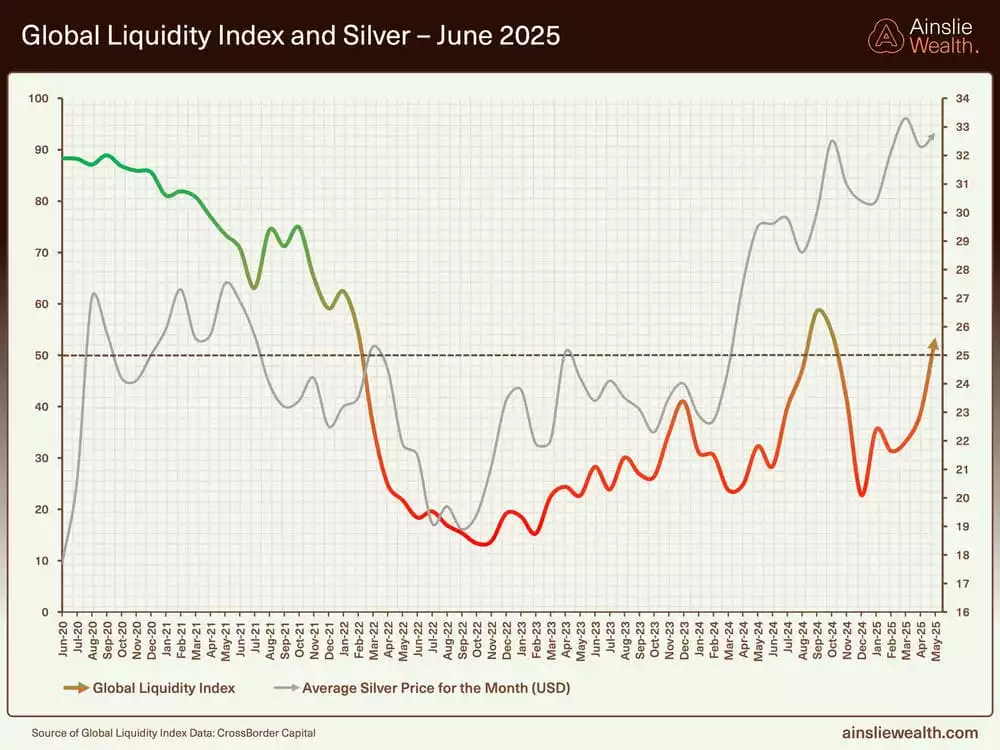
We can take advantage of the Macro Cycles by strategically allocating between the Macro Assets (Bitcoin, Gold, and Silver) during the optimal cycle stages.
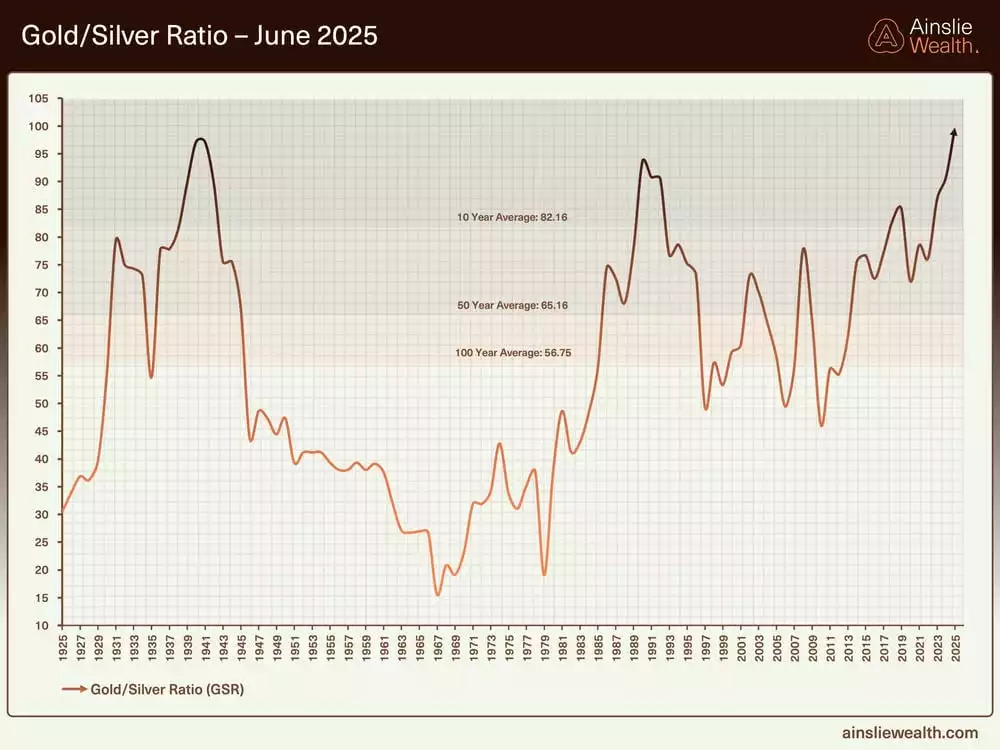
Gold’s strength persists, hovering near all-time highs despite positive real yields, reflecting a shift in traditional market dynamics. Broad-based support, especially from central banks, caps downside risk, even as prices pause after a prolonged rally. Silver, meanwhile, emerges as a compelling late-cycle opportunity. The gold-to-silver ratio, currently around 93:1, suggests undervaluation; historical patterns indicate that a drop towards the low 80s or high 70s could spark a sharp rally. As liquidity accelerates, silver’s potential to outperform may draw investors seeking amplified returns.
A Simple Trading Plan to take advantage of the cycles
Watch the video presentation to see full details of the specific Trading Plan we provide, that you can follow, which has returned 209.3% p.a. as at Tuesday’s recording.
We will return in July to assess what has changed and keep you updated with everything you need to know. Until then, good luck in the markets!
Chris Tipper
Chief Economist and Strategist
The Ainslie Group
x.com/TipperAnalytics
Note: The monthly video presentation is recorded live with our expert panel. Our objective is to make the updates as useful and specific to what you want to understand as possible, so as always feel free to reach out with any questions or feedback that we can incorporate into next month’s video to make it something that provides you with the highest possible value for your time!