Macro and Global Liquidity Analysis: Gold, Silver, and Bitcoin – July 2025
News
|
Posted 01/08/2025
|
1753
Today the Ainslie Research team brings you the latest monthly update on where we are in the Global Macro Cycle, driven by the Global Liquidity Cycle, and the implications for Gold, Silver, and Bitcoin. This summary highlights the key charts discussed with our expert panel on Tuesday. We encourage you to watch the recorded video of the presentation in full for the detailed explanations.
Where are we currently in the cycles?
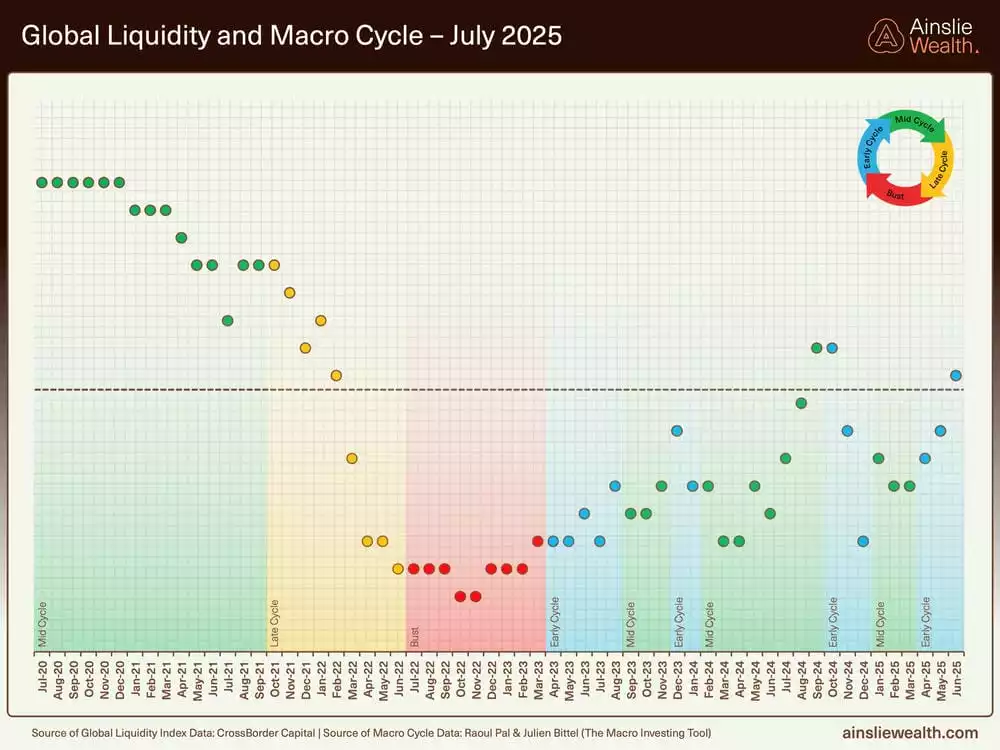
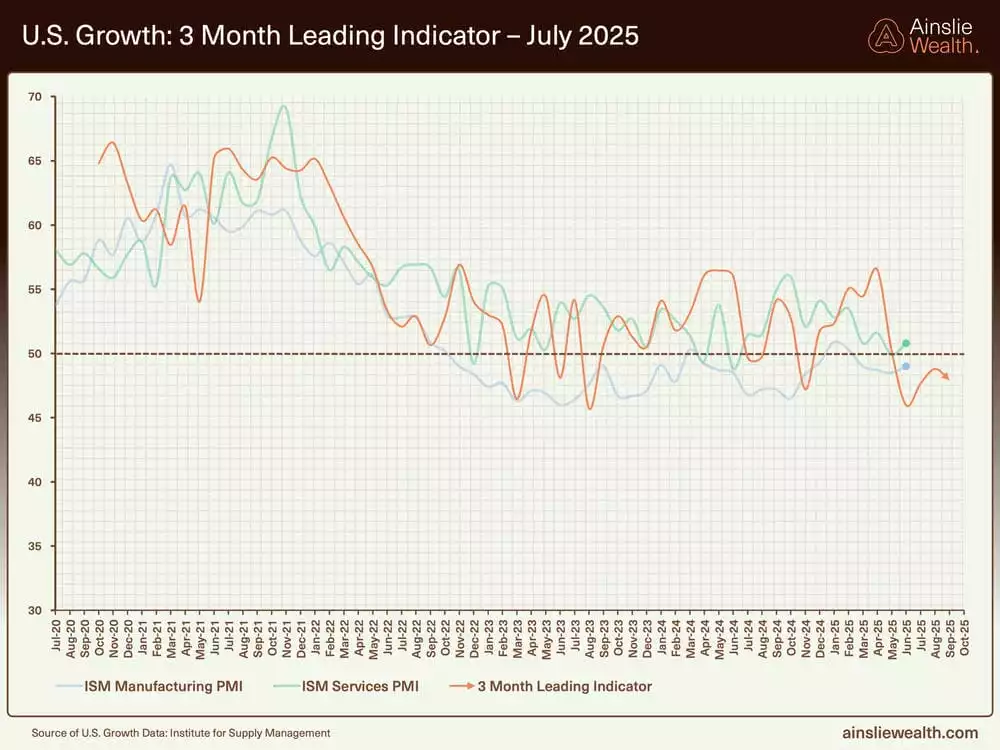
The market continues to exhibit characteristics of an early cycle phase, with subdued inflation and growth delaying any transition to mid-cycle dynamics. Recent geopolitical tensions and trade disruptions have weighed on global consumer spending, extending the cycle potentially well into 2026. Services activity has moderated, while manufacturing remains tepid, supported primarily by inventory accumulation in the US rather than broad-based demand. Equity markets and risk assets, including Bitcoin, show resilience with steady recoveries from dips, indicating the uptrend has endurance. This framework suggests the cycle is not yet mature, providing scope for sustained gains amid ongoing liquidity support, though vigilance for emerging pressures remains essential.

Deep dive on the Global Liquidity Cycle
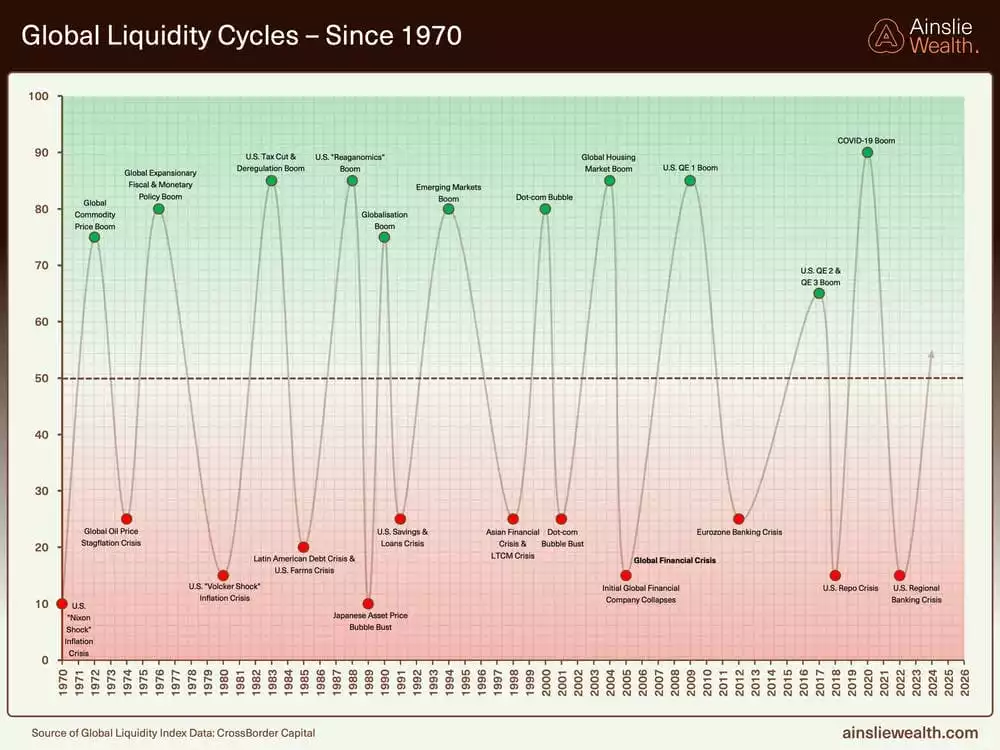
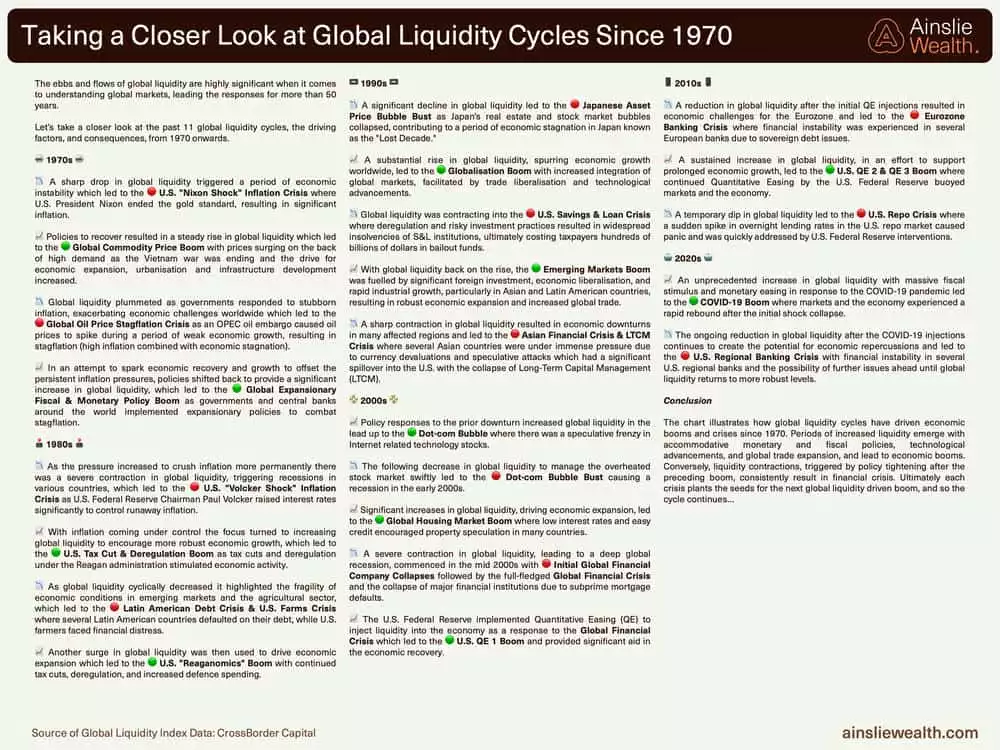
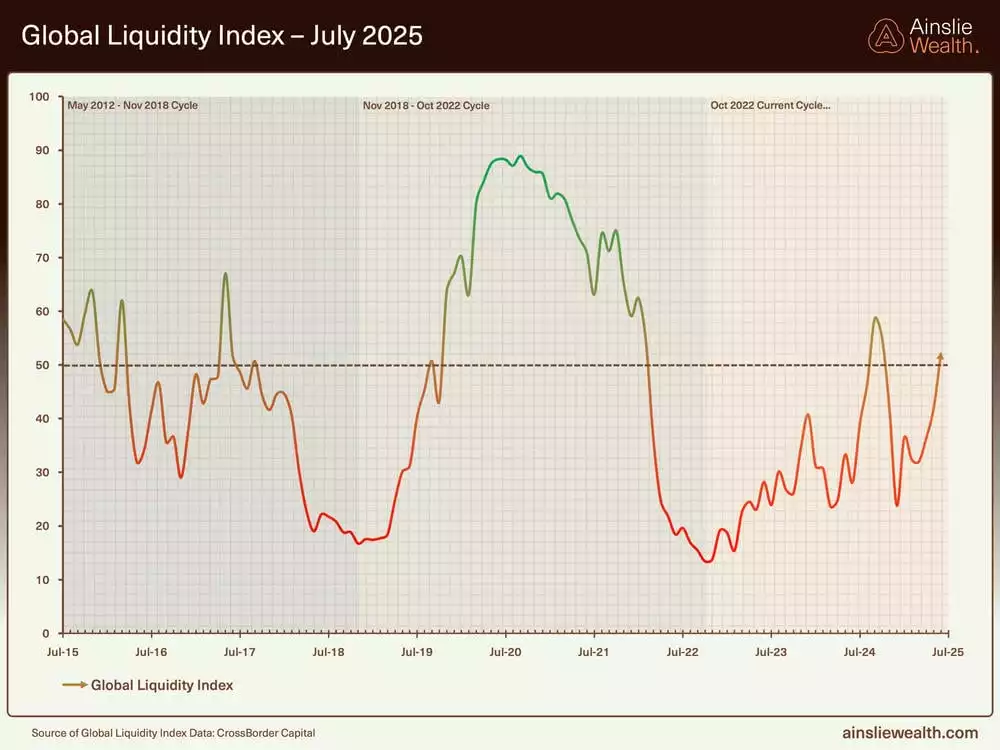
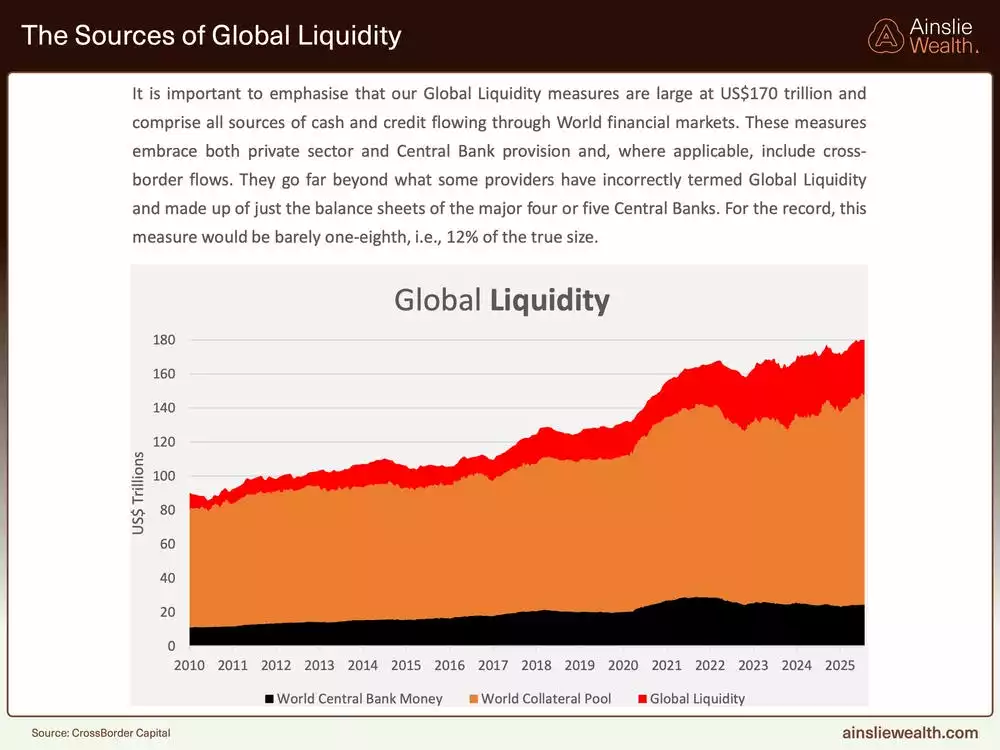
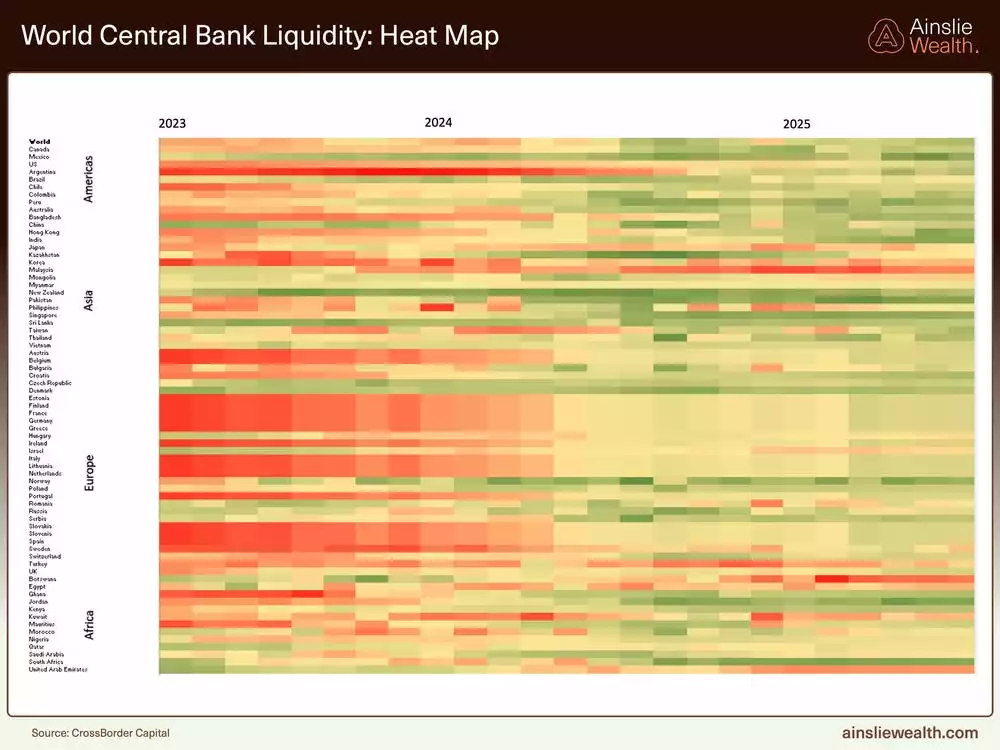
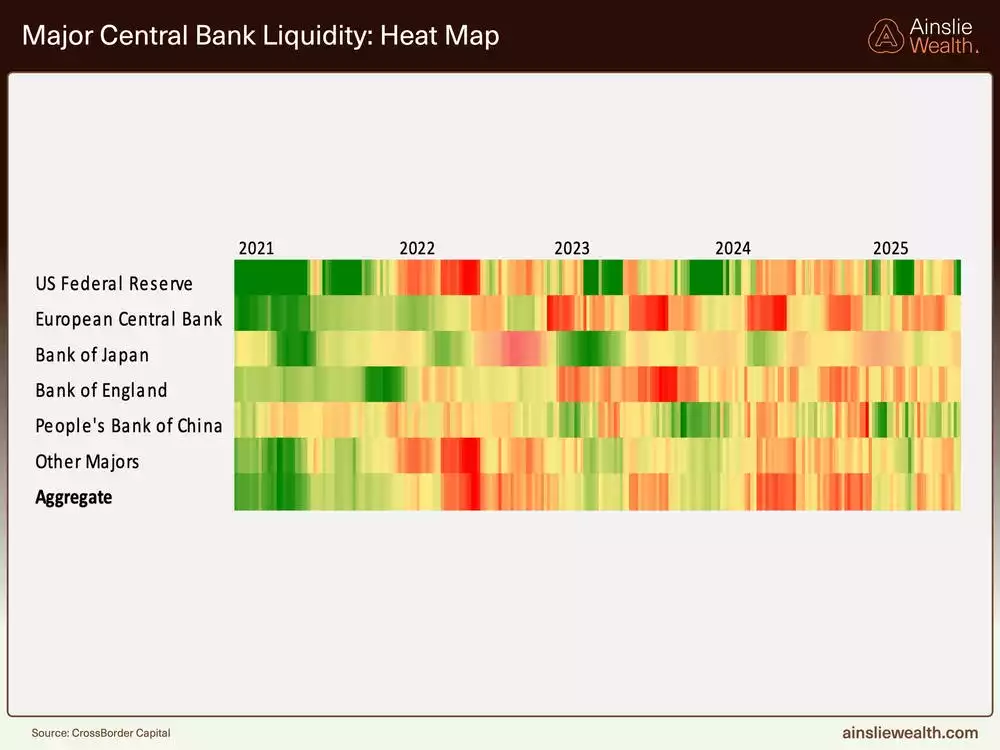
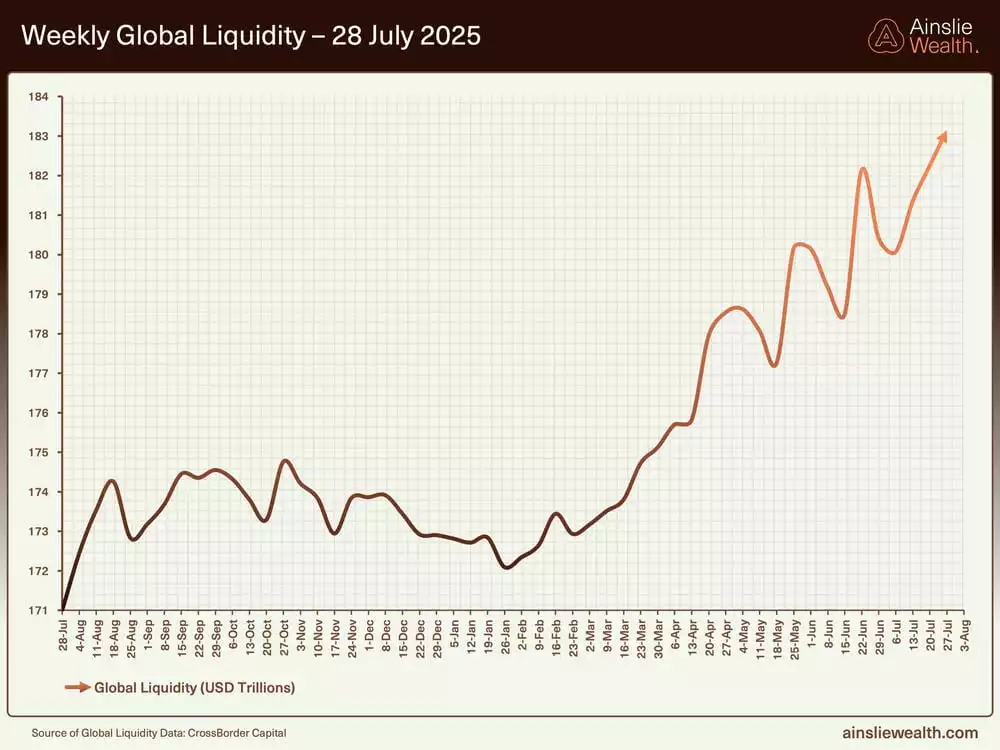
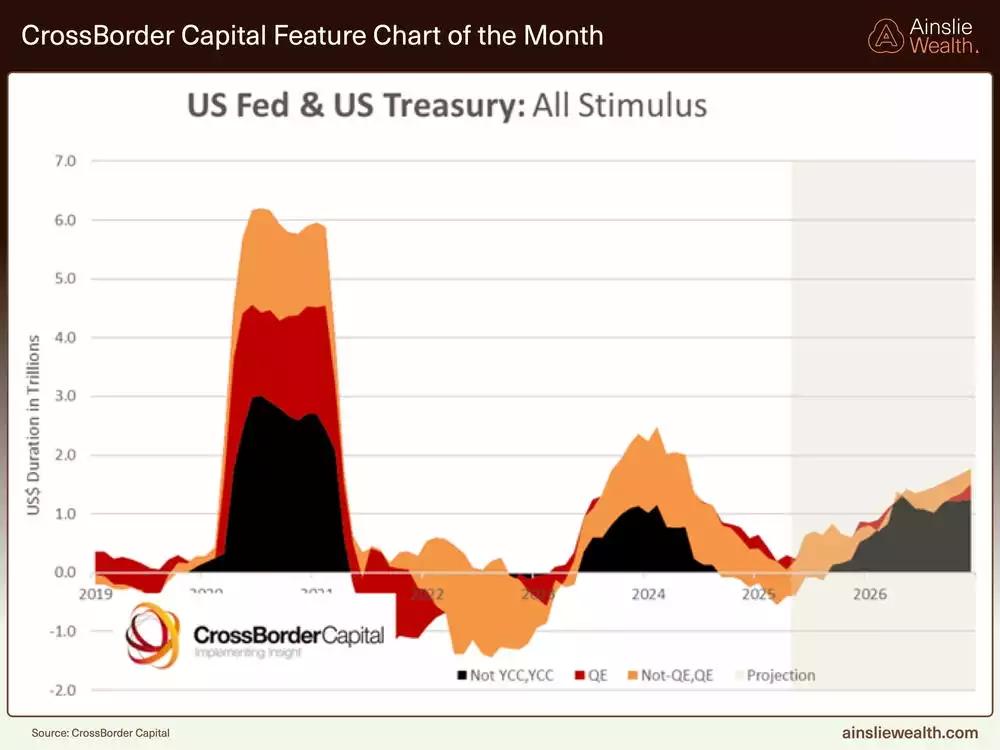
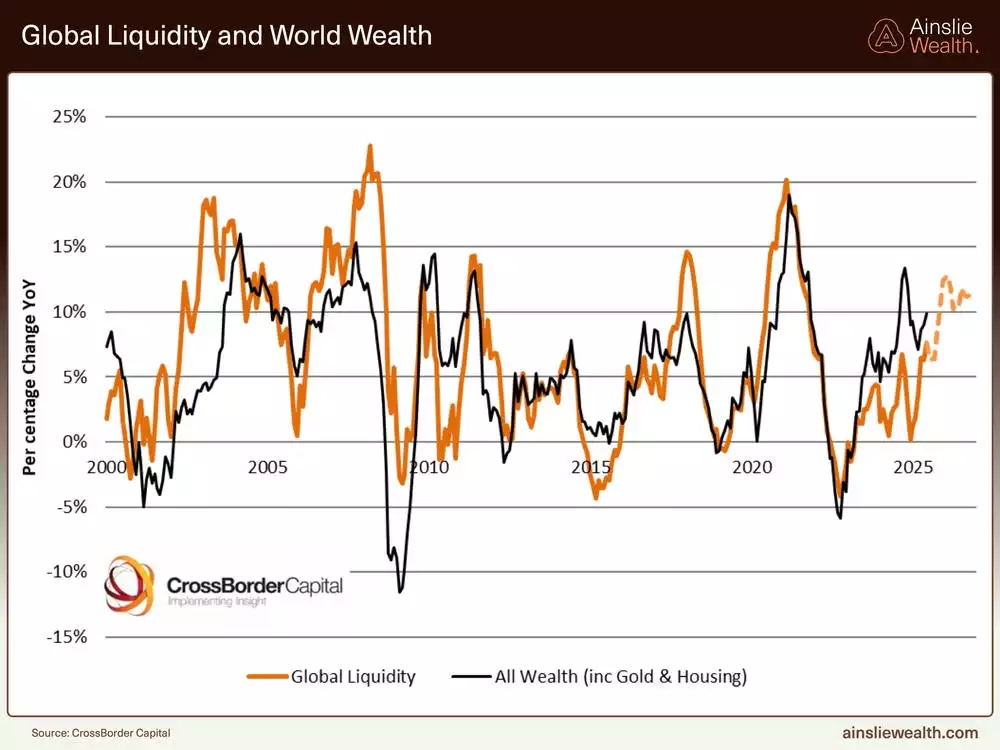
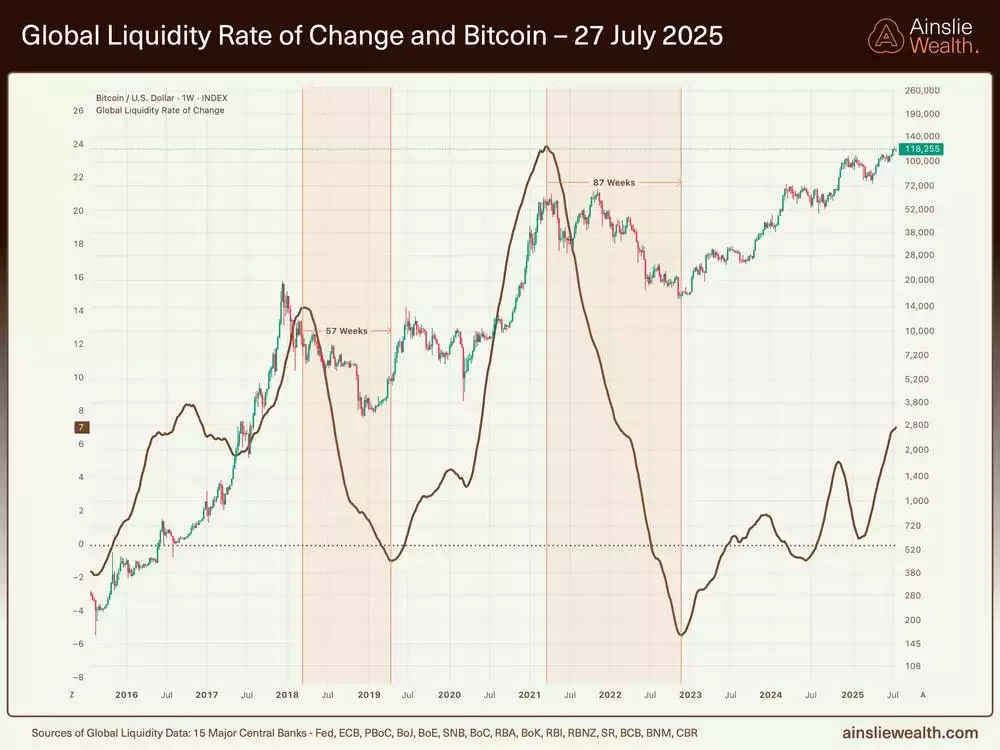
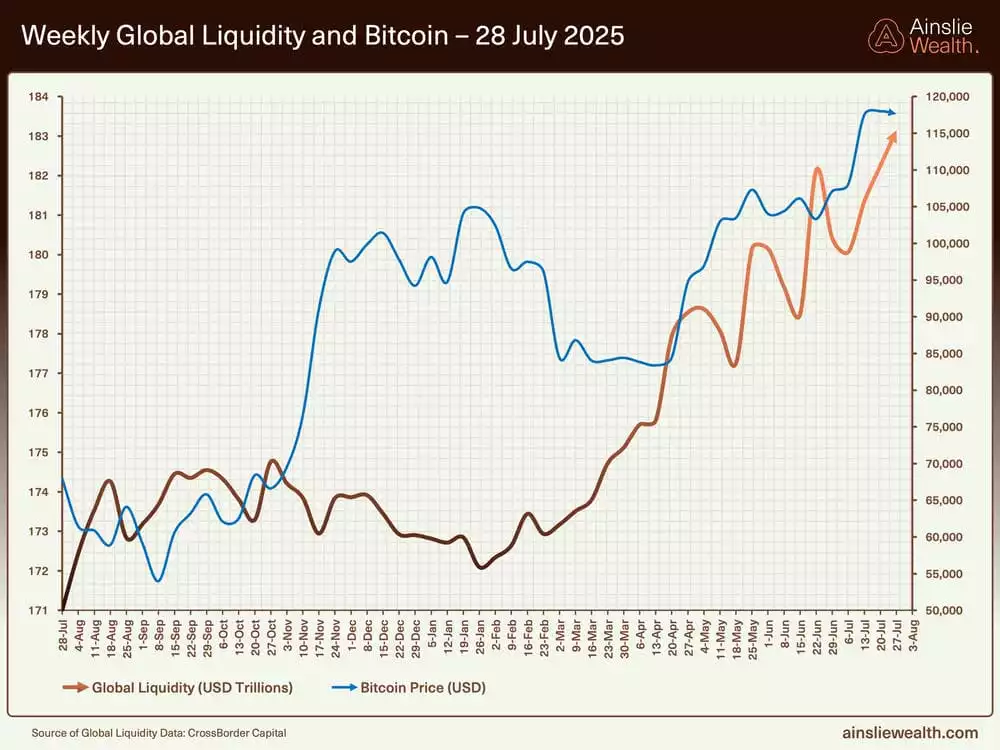
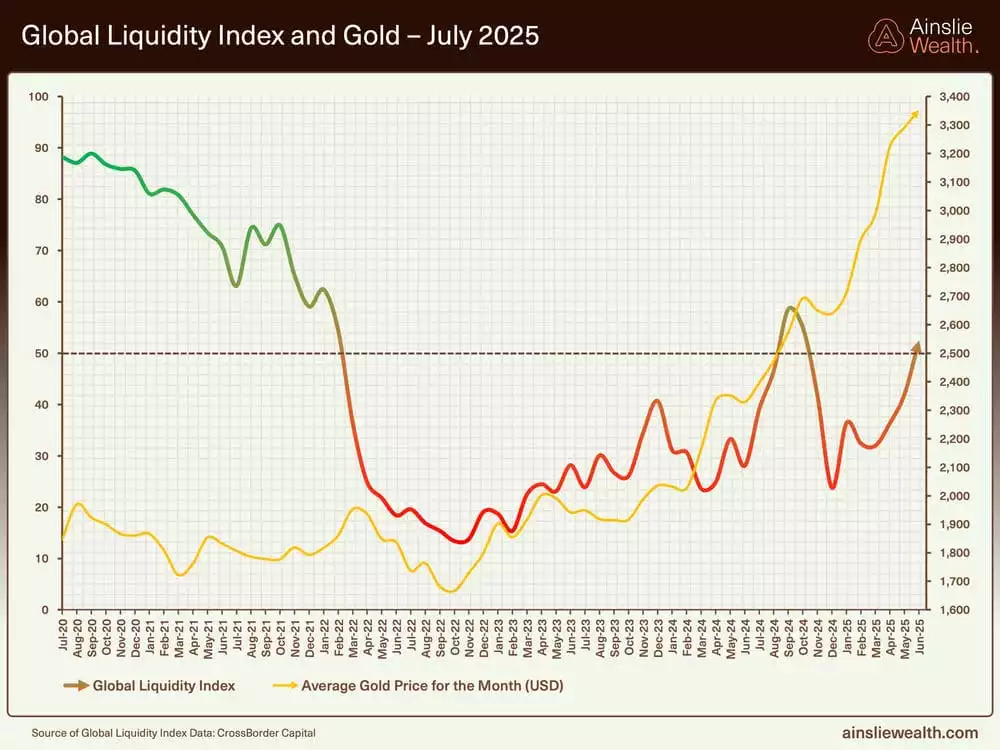
Global liquidity has resumed its upward trajectory, recently revised higher due to substantial stimulus measures, particularly from China, which has injected around US$1.5 trillion equivalent over the past six months. Central banks worldwide are synchronising efforts, with quantitative tightening in major economies like the US, Europe, and Japan offset by fiscal actions such as the US Treasury's planned refinancing of US$1.6 trillion, much of which will flow back into the economy. Weekly data reveals improving momentum, shifting from mixed signals to predominantly positive contributions, though not at explosive levels. This constructive environment, marked by collateral value stability and reduced bond volatility, counters potential short-term disruptions and reinforces a supportive backdrop for asset appreciation as liquidity expansion persists.
Deep dive on the Global Macro Cycle
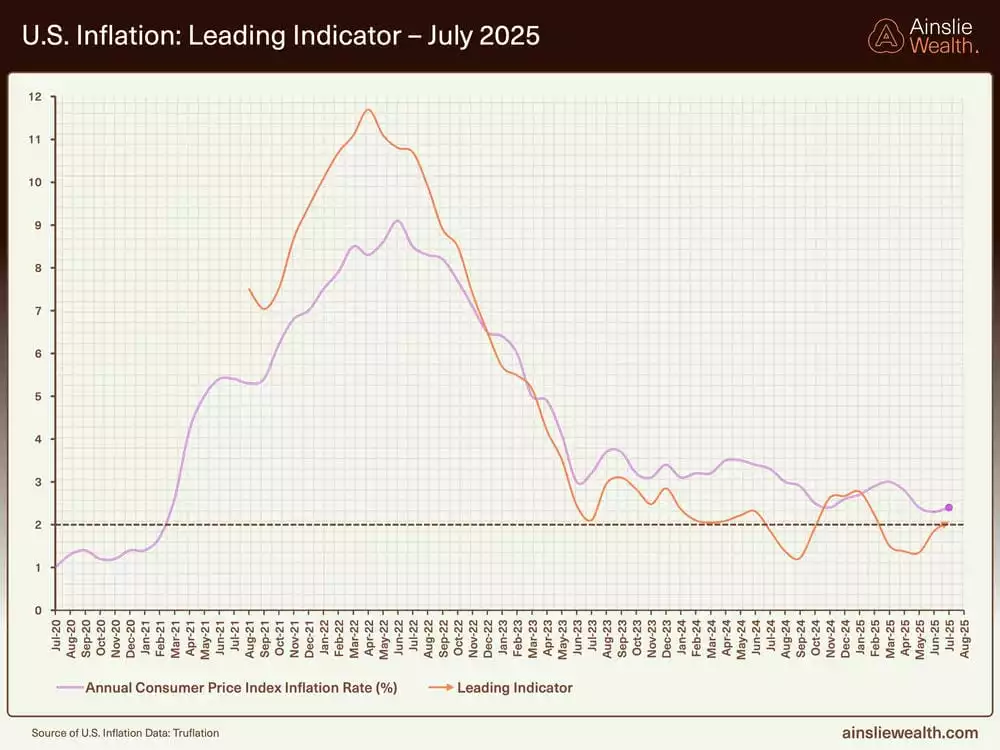
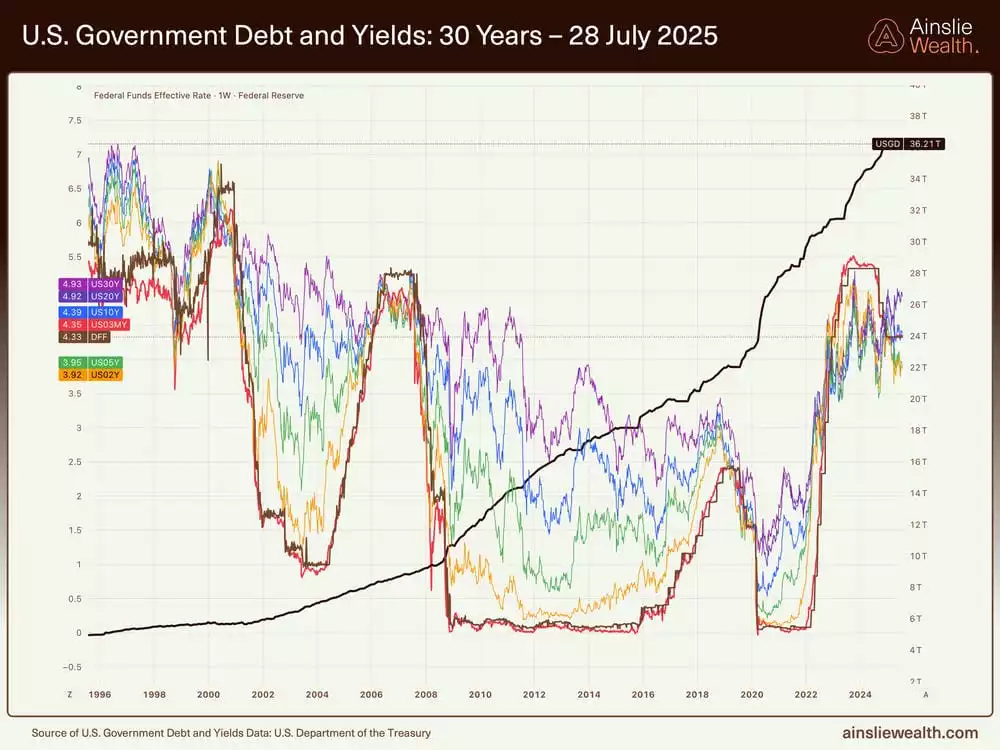
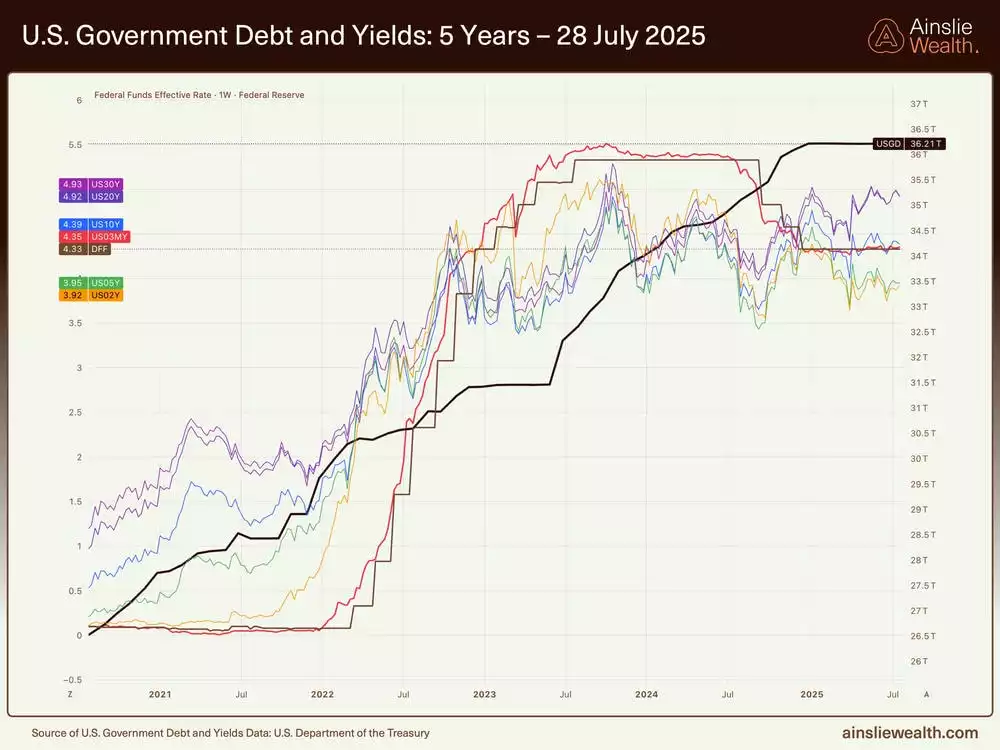
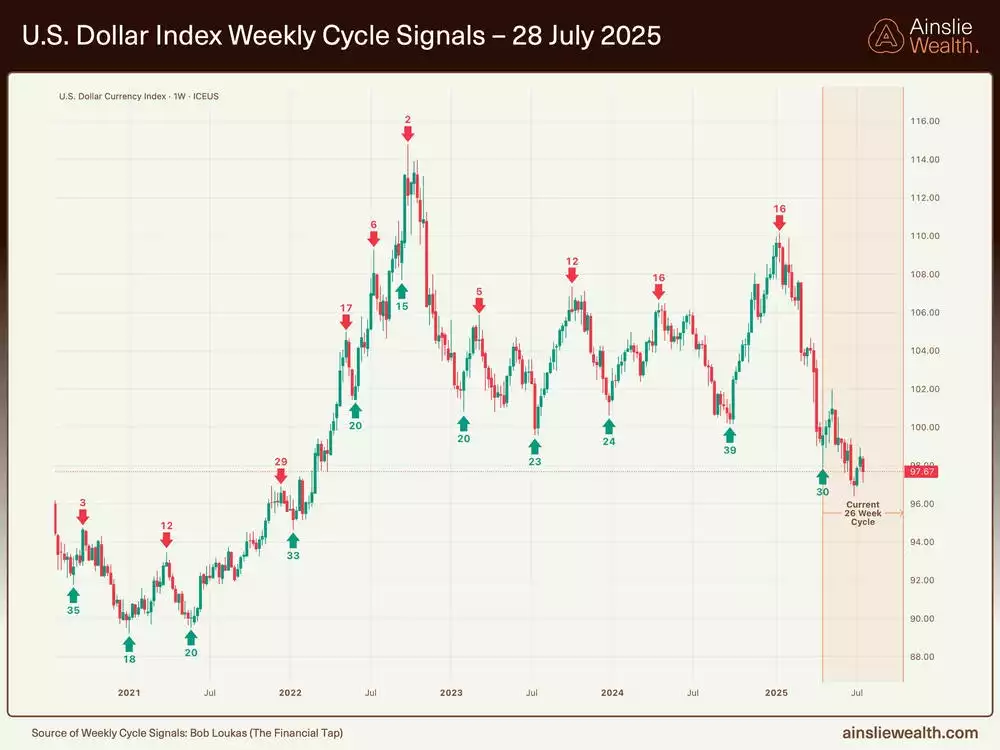
Economic indicators point to a gradual evolution within the early cycle, where fiscal dominance is increasingly driving growth amid restrained monetary policy. In the US, anticipated multi-trillion-dollar spending on infrastructure, including AI-related buildouts like data centres and power grids, is set to boost productivity and real wage growth, potentially allowing for higher inflation tolerance above the 2% target without derailing expansion. Manufacturing has shown tentative improvement in response to trade policies, while services have softened, keeping overall activity balanced. Sovereign debt refinancing challenges loom, with elevated yields reflecting supply pressures, yet a weakening US dollar could alleviate global funding strains and enhance liquidity transmission. This setup anticipates inflation stabilising around 3%, aligned with productive investments that extend the cycle's productive phase.
Deep dive on the Bitcoin Cycle
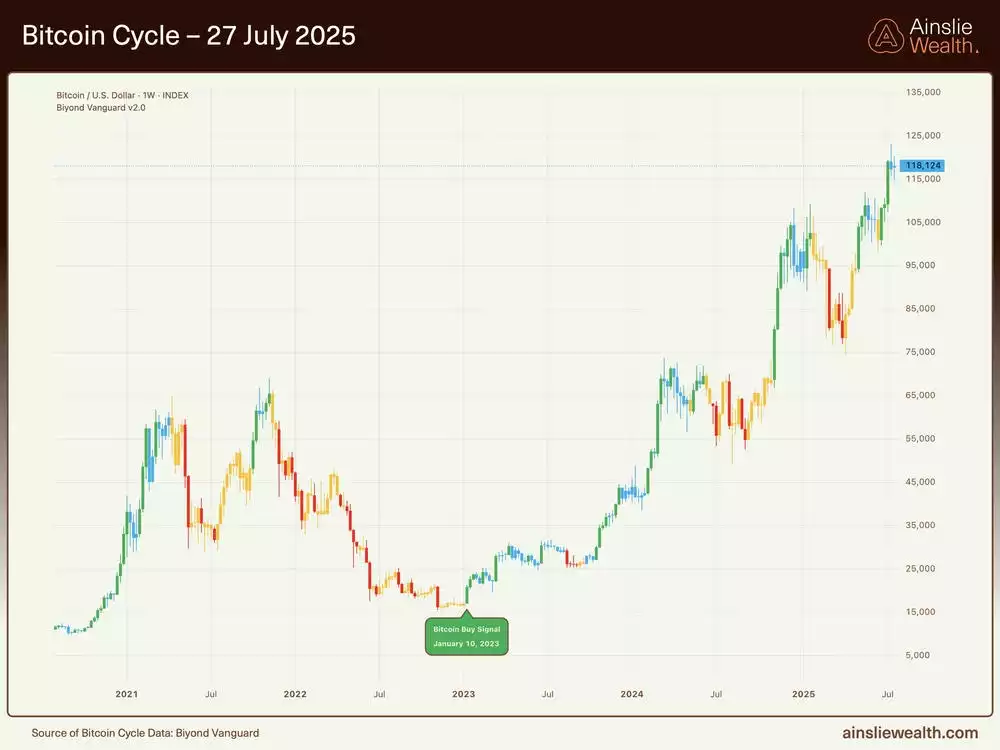
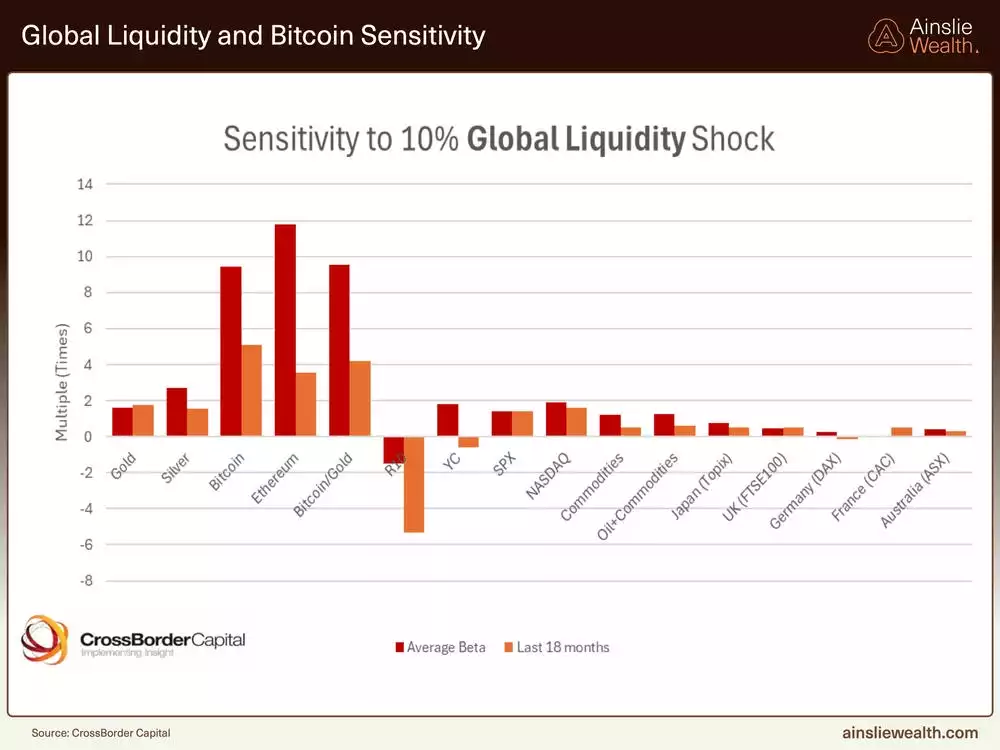
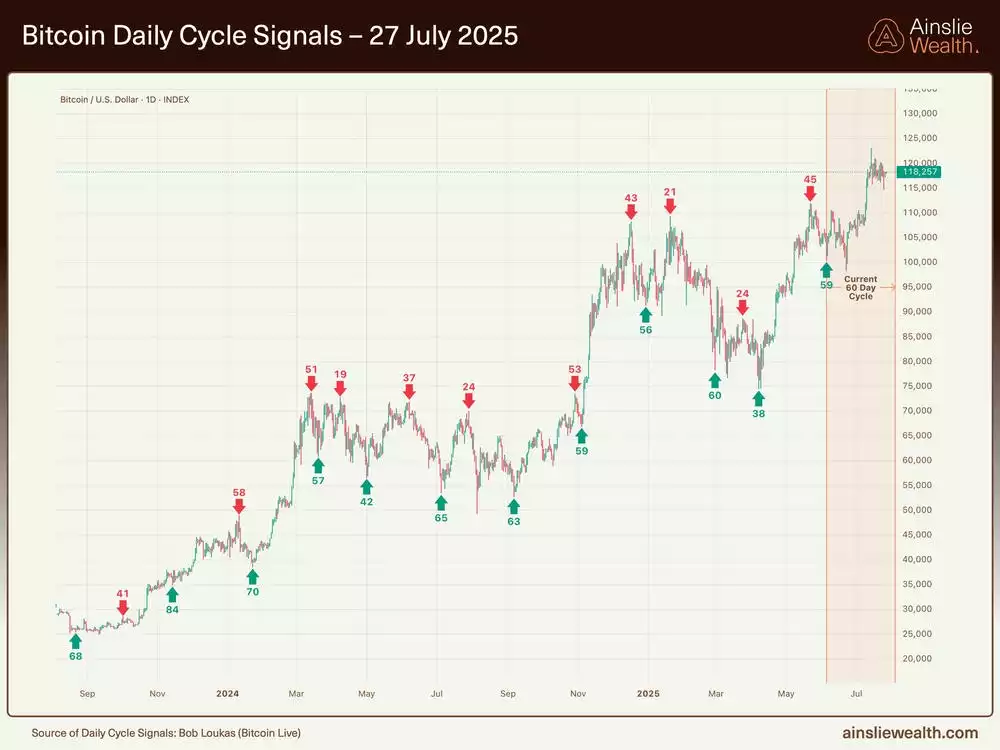
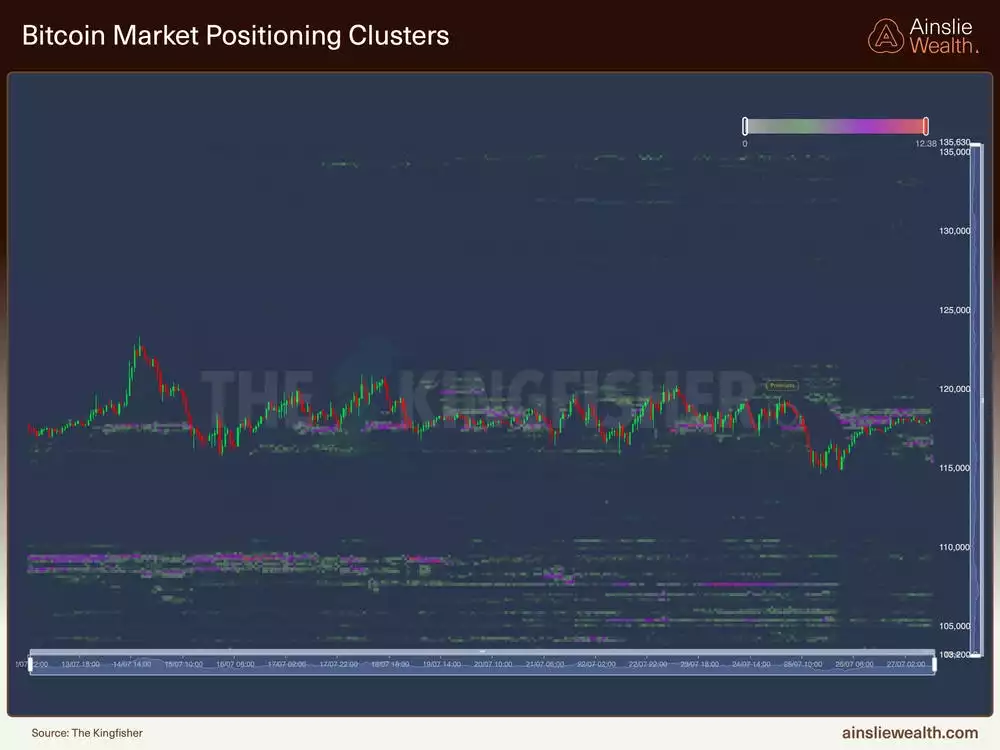
Bitcoin's performance remains tightly linked to liquidity dynamics, demonstrating heightened sensitivity where historical patterns indicate amplified responses to even modest expansions in global liquidity. Recent price action reflects a maturing market, characterised by stepwise advances rather than parabolic surges, bolstered by institutional participation that provides a floor during consolidations. Cycle analysis, including shorter-term rhythms, shows no signs of late-stage exhaustion, with dips serving as accumulation opportunities amid ongoing adoption by corporates and treasuries. As liquidity trends higher through synchronised global efforts, the asset's trajectory suggests continued upside potential, guided by broader cycle progression rather than isolated price milestones, favouring long-term holders in this phase.

Gold and Silver
We can take advantage of the Macro Cycles by strategically allocating between the Macro Assets (Bitcoin, Gold, and Silver) during the optimal cycle stages.
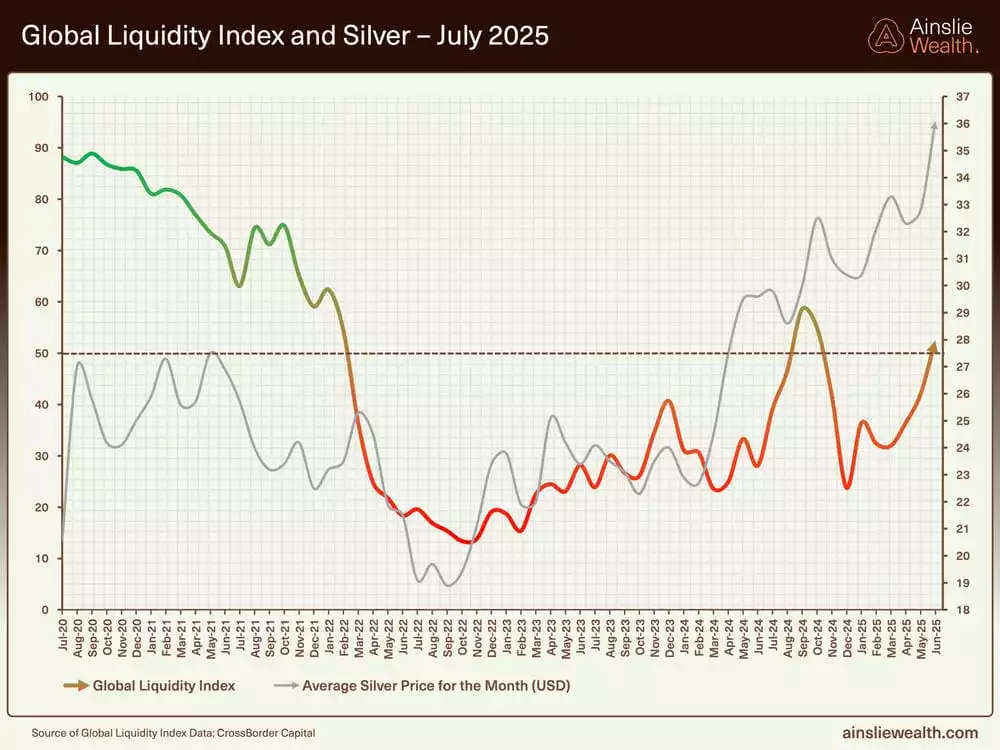
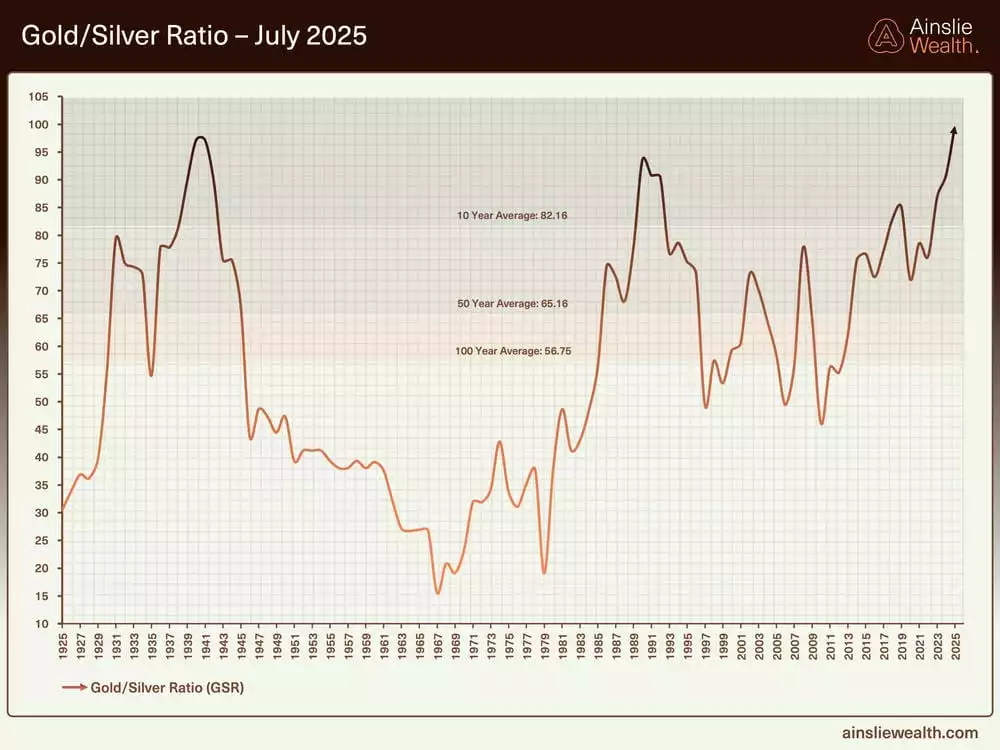
Gold maintains its robust positioning near recent highs, consolidating after a significant rally amid trade uncertainties, with central bank demand limiting downside risks. Silver, however, presents an attractive opportunity as industrial fundamentals strengthen, driven by supply deficits and surging demand from AI infrastructure, electronics, and solar applications. The gold-to-silver ratio has declined to around 86:1, signalling relative undervaluation and potential for further compression towards historical lows, which could trigger outsized gains in silver. Both metals benefit from liquidity sensitivity, with silver exhibiting greater responsiveness, positioning it for outperformance as the cycle advances and economic tailwinds intensify.
A Simple Trading Plan to take advantage of the cycles
Watch the video presentation to see full details of the specific Trading Plan we provide, that you can follow, which has returned 231.6% p.a. as at Tuesday’s recording.
Watch the full presentation with detailed explanations and discussion on our YouTube Channel here:
We will return in August to assess what has changed and keep you updated with everything you need to know. Until then, good luck in the markets!
Chris Tipper
Chief Economist and Strategist
The Ainslie Group
x.com/TipperAnalytics
Note: The monthly video presentation is recorded live with our expert panel. Our objective is to make the updates as useful and specific to what you want to understand as possible, so as always feel free to reach out with any questions or feedback that we can incorporate into next month’s video to make it something that provides you with the highest possible value for your time!