Macro and Global Liquidity Analysis: Gold, Silver, and Bitcoin - July 2024
News
|
Posted 26/07/2024
|
4026
Today the Ainslie Research team brings you the latest monthly update on where we are in the Global Macro Cycle, driven by the Global Liquidity Cycle, and the implications for Gold, Silver, and Bitcoin. This summary highlights the key charts that were discussed with our expert panel on Monday. We encourage you to watch the recorded video of the presentation in full for the detailed explanations.
Where are we currently in the Global Macro Cycle?
We remain in the Mid Cycle phase of the Global Macro Cycle. We continue to experience choppy data from the global economy, with no clear break higher so far. The stable position below the halfway line indicates there is still plenty of runway for upward momentum in the months ahead as the cycle responds to the additional liquidity and stimulus expected in the 2nd half of 2024.

Where are we currently in the Global Liquidity Cycle?
Global Liquidity leads the movement of World financial assets, so this is the indicator we look most closely at to determine where the opportunities are to take advantage of. It is currently recovering from the cycle lows.


You can clearly see the shift from the red patch where liquidity was being drained on average from global markets in 2022 and 2023 to greens and lighter neutral yellows starting to dominate as the liquidity picture improves.

Do U.S. Growth and Inflation support where we think we are in the Global Macro Cycle?
In terms of economic growth in the U.S., as evidenced by the ISM data, we remain below the 50-line indicating contraction for July for manufacturing data, and services experienced a sharp pullback.

However, the forward-looking indicator over the next 3 months indicates we can expect to see growth returning into the expansion territory in the months ahead.

In terms of U.S. inflation, our leading indicator shows that the lagging government reported rate continues to remain higher than the real-time data, so there is no strong upward pressure on the rate expected over the next few months. The leading indicator suggests that the real rate of inflation has broken below the much watched 2% level, which is the Federal Reserve’s stated target.

Does the behaviour of U.S. Government Debt, Yields and the Dollar support where we think we are in the Global Macro Cycle?
U.S. government debt continues its relentless, and increasingly exponential, march higher with no meaningful attempts to bring it under control.

Bond yields remain relatively stable and range bound. We continue to wait and see if there is an acceleration of yields higher as a major warning sign that we are heading into a situation where the Fed or the government will be forced to respond as issuance picks up later in the year, or whether yields fall in line with expected Fed rate cuts.

The U.S. Dollar is also at a pivotal point where we expect a break one way or the other out of an increasingly tight range. A break higher would provide headwinds for asset prices, while a break lower is likely to provide further support going forward, all else remaining equal.

Looking more closely at Weekly Global Liquidity, does it support our expectations for the direction of the next move in the Global Liquidity Cycle?
At a weekly level, Global Liquidity looks to finally be showing some strength to push out of the choppy range we have experienced for the past few months.

This is largely on the back of very recent moves by China to start increasing their liquidity measures. China is the 2nd largest contributor to Global Liquidity, and relative to the rest of the world they have been the main country holding the broader index down.

Macro Assets for Macro Cycles
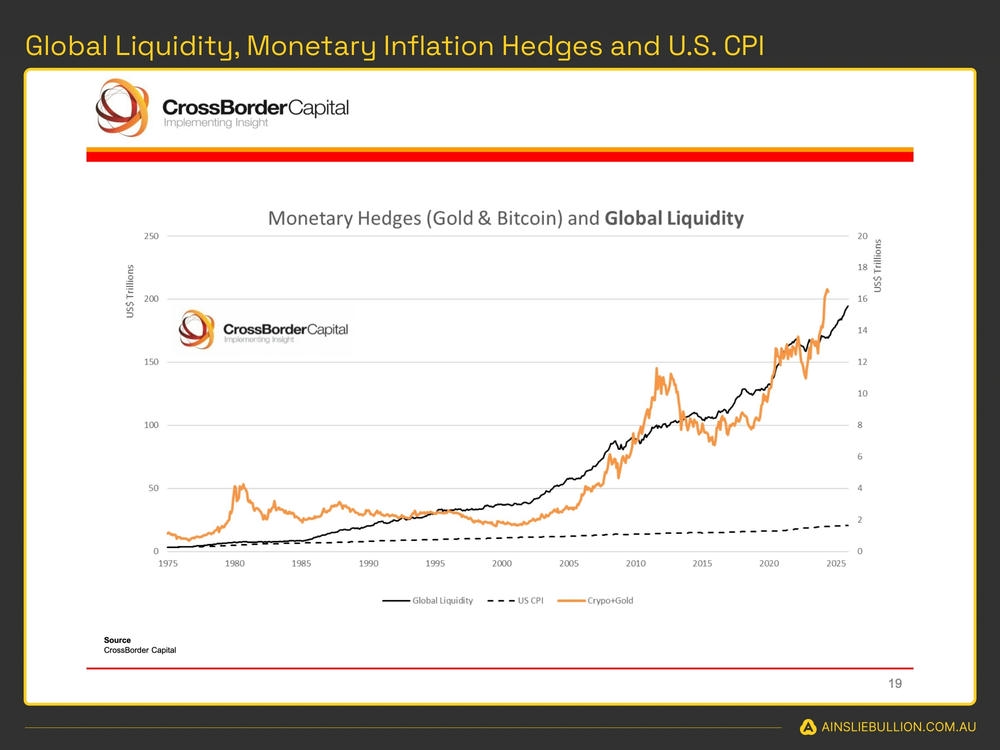
Understanding Consumer Price Inflation (CPI) is far less important than Asset Price Inflation in ensuring wealth isn’t eroded, and can actually grow, over the long term. A combination of Gold, Silver, and Bitcoin keep up with the growth in Global Liquidity over time, and the corresponding debasement of fiat currencies. As such we look to trade into each at the appropriate times to take optimum advantage of the cycles. When correctly timing and structuring the rotation, it is possible to significantly outperform ongoing monetary debasement.
The Gold cycle low was in September 2022 and the price has been rising consistently with an improving Global Liquidity picture ever since. The recent continued strength and new all-time highs have been especially bullish, pushing even higher on the back of the recent geopolitical uncertainty and front running the expected liquidity to come.

It is a similar story with Silver which also had a cycle low in September 2022 and has exploded higher with recent gains.

It remains prudent to key an eye on the Gold Silver Ratio (GSR), as when the ratio falls it can happen very suddenly, as we have had a glimpse of recently with Silver.

Bitcoin is the most directly correlated asset to Global Liquidity. Trading Bitcoin can be thought of as trading the Global Liquidity Cycle, but with an adoption curve that leads to significantly higher highs and lows each cycle.

The Bitcoin cycle low was in November 2022, and since then the returns have been unmatched by any other major asset. Recently breaking through all-time highs and for the most part maintaining those gains with historically smaller than average drawdowns along the way suggests that the Bitcoin market is looking through the short-term Global Liquidity volatility noise to the much higher levels on the horizon.

A Simple Trading Plan to take advantage of the cycles
Watch the video presentation to see full details of the specific Trading Plan we provide, that you can follow, which has returned 190.8% p.a. as at Monday’s recording.

Watch the full presentation with detailed explanations and discussion on our YouTube Channel here:
Until next month when we return to reassess and identify what has changed, good luck in the market!
Chris Tipper | Chief Economist and Strategist
The Ainslie Group
x.com/TipperAnalytics
Note: The monthly video presentation is recorded live with our expert panel. Our objective is to make the updates as useful and specific to what you want to understand as possible, so as always feel free to reach out with any questions or feedback that we can incorporate into next month’s video to make it something that provides you with the highest possible value for your time!