Macro and Global Liquidity Analysis: Gold, Silver, and Bitcoin – January 2025
News
|
Posted 31/01/2025
|
9674
Today the Ainslie Research team brings you the latest monthly update on where we are in the Global Macro Cycle, driven by the Global Liquidity Cycle, and the implications for Gold, Silver, and Bitcoin. This summary highlights the key charts discussed with our expert panel on Tuesday. We encourage you to watch the recorded video of the presentation in full for the detailed explanations.
Where are we currently in the cycles?
Despite the choppiness across markets in late 2024 and early 2025, we believe the broader picture still points to an overall uptrend in liquidity and risk assets. From the charts, global liquidity shows a “lumpy grind” upward—still expanding, even if unevenly—while macro indicators remain in a mid‐cycle stage that suggests room yet to run before a late‐cycle slowdown. On the Bitcoin front, the data continues to support a bull market phase, with recent volatility looking more like a healthy pullback than the start of a final top. Taken together, these three views—liquidity, macro, and Bitcoin—reinforce the idea that any near‐term corrections could present opportunities rather than signal the end of this ongoing cycle.


Deep dive on the Global Liquidity Cycle
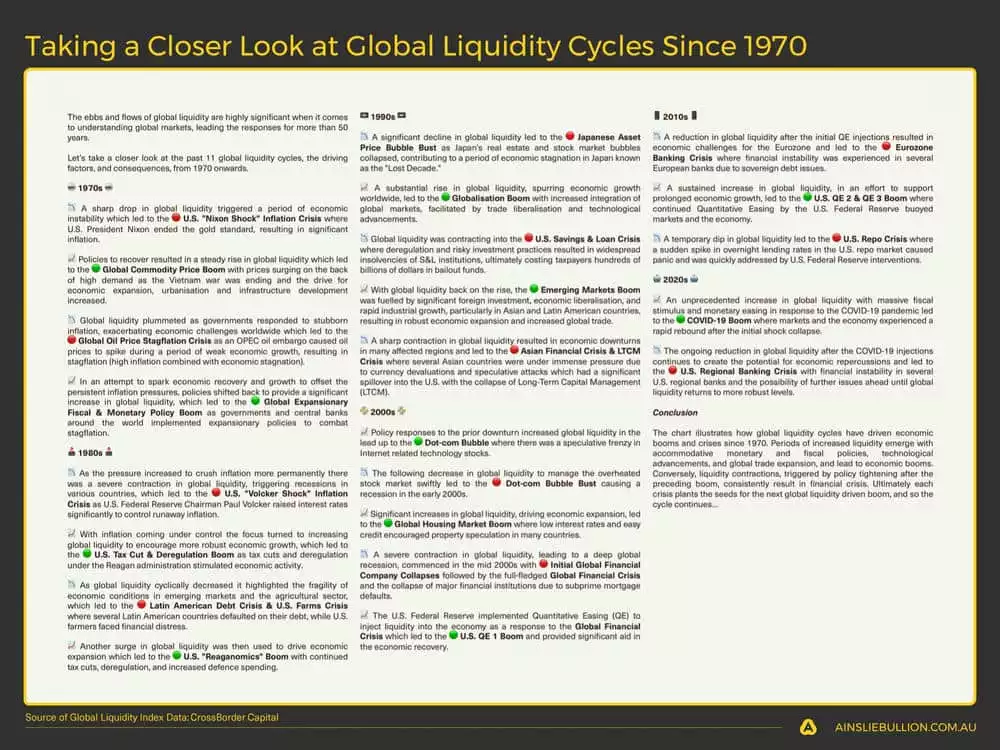
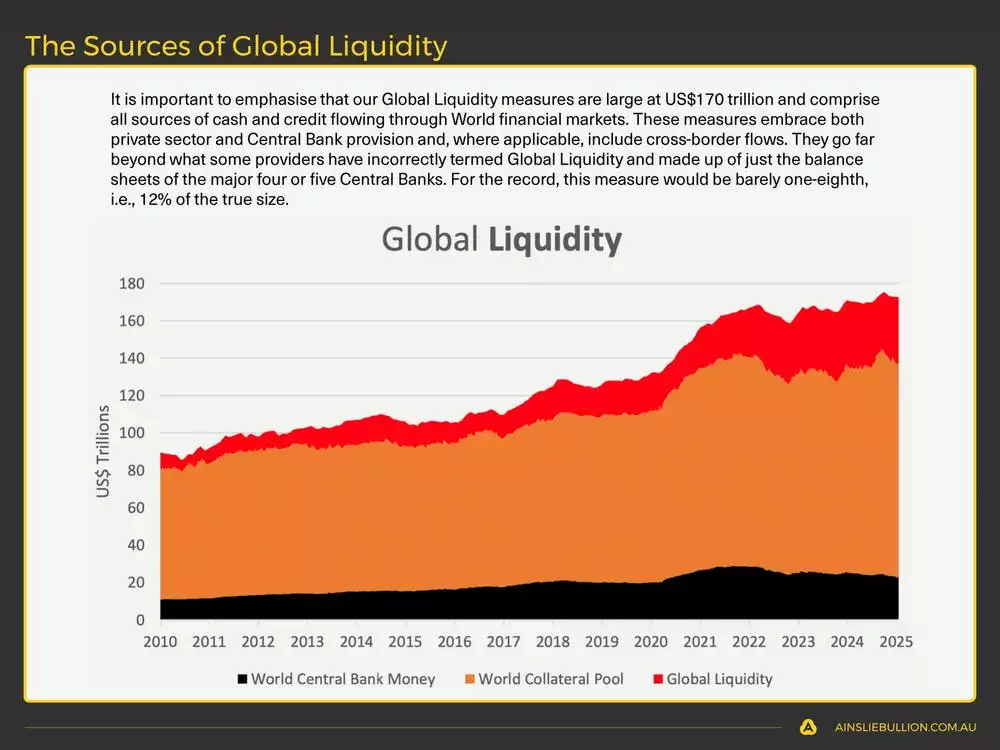
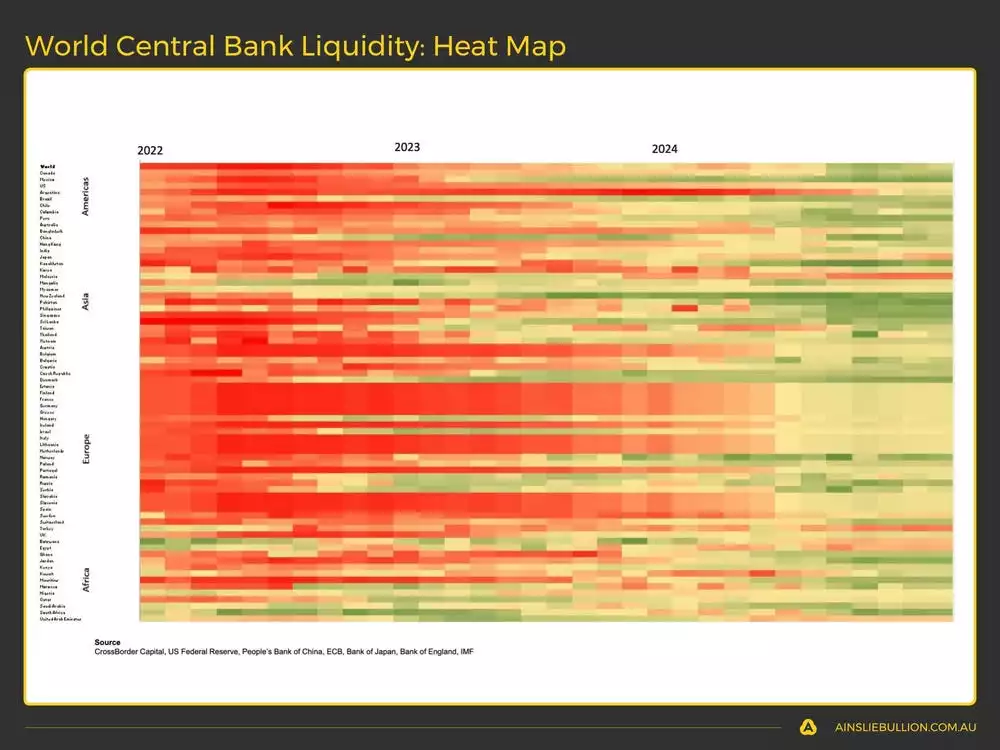
Global liquidity, as shown in the heat map and weekly charts, remains buoyant but has stalled somewhat around mid‐range levels—largely because the biggest providers (namely the U.S. and China) have not kicked into high gear. While numerous smaller central banks appear to be adding liquidity (resulting in swathes of green in the heat map), their collective impact is relatively minor compared to policy moves from China and the Federal Reserve. So far, both have remained somewhat neutral: China has jawboned about stimulus without delivering aggressively, and the U.S. has balanced easing in select programs with ongoing quantitative tightening. Any pivot, however, such as the Fed shifting from QT to even a neutral stance—or if China’s recent signals translate into genuine large‐scale stimulus—could quickly reverse the current stall and send global liquidity soaring again.



Deep dive on the Global Macro Cycle
U.S. economic growth continues to surprise to the upside, with small business confidence skyrocketing—likely thanks to relaxed regulations, prospective tax cuts, and the Trump administration’s push to entice companies back onshore. At the same time, inflation has been hovering near the 3% mark, a level that the Federal Reserve seems content to tolerate (even if they won’t explicitly say so). The looming question for markets, however, is how the government will manage its enormous debt rollover later this year: bond yields have already crept higher, rekindling worries about a potential bond market shakeup. Yet, as we point out, the Fed has an arsenal of tools—including a return to bond‐buying (QE by another name)—which could cap yields and supply the liquidity needed to refinance. Intriguingly, though, the very liquidity surge that might save the debt market could also signal the beginning of the end of this cycle by reigniting inflation and eventually undermining confidence in the U.S. dollar.


Deep dive on the Bitcoin Cycle
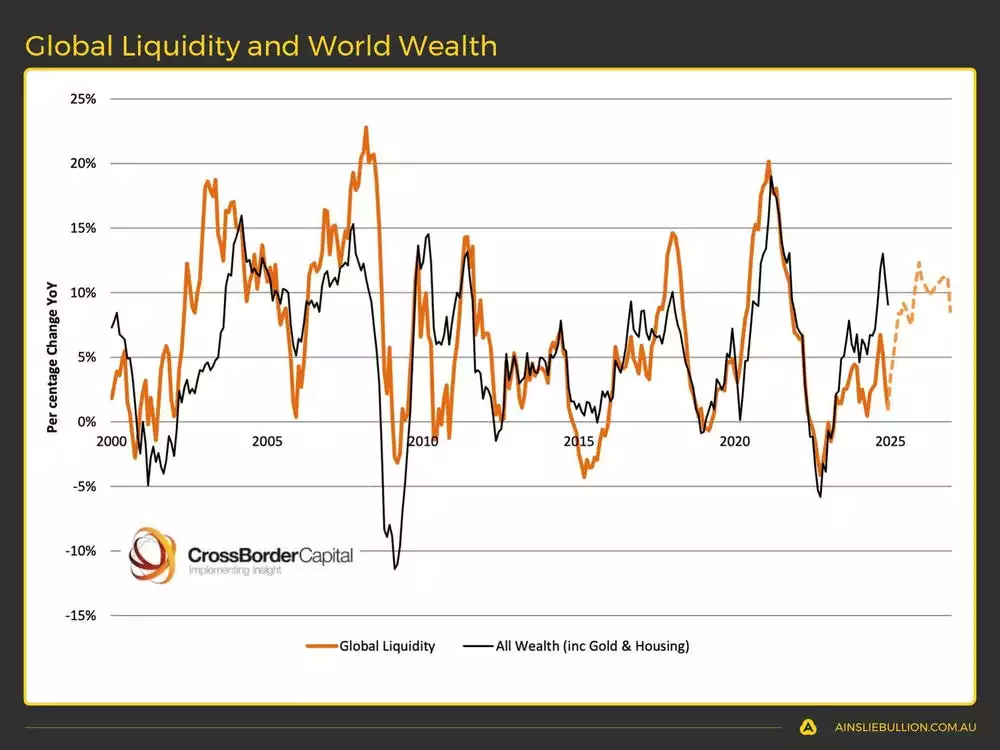
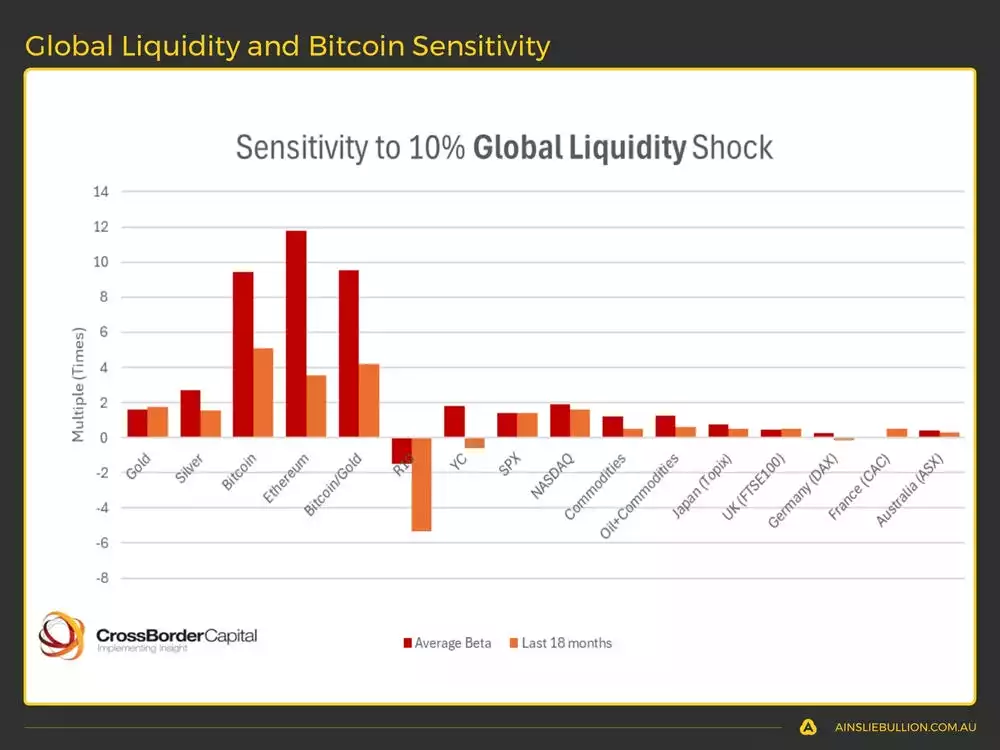
Bitcoin’s unique sensitivity to liquidity lies at the heart of why we track it so closely, rather than mere “crypto enthusiasm.” As the charts show, a 10% change in global liquidity can drive an exponential response in Bitcoin, outpacing even gold (which itself benefits from monetary debasement). It works both ways, though: high liquidity sees Bitcoin soar, but tightening can cause sharp declines. For us, that volatility is a feature rather than a bug—providing outsized returns if we capture the bulk of an uptrend and switch to safer assets like gold when markets turn. We also use tools like “fish finder” heat maps of liquidation clusters to gauge whether the market is likely to flush out leveraged positions before resuming its broader trend. Ultimately, the appeal of Bitcoin is that no other asset offers such a direct play on the ebb and flow of global liquidity.



Gold and Silver
We can take advantage of the Macro Cycles by strategically allocating between the Macro Assets (Bitcoin, Gold, and Silver) during the optimal cycle stages.
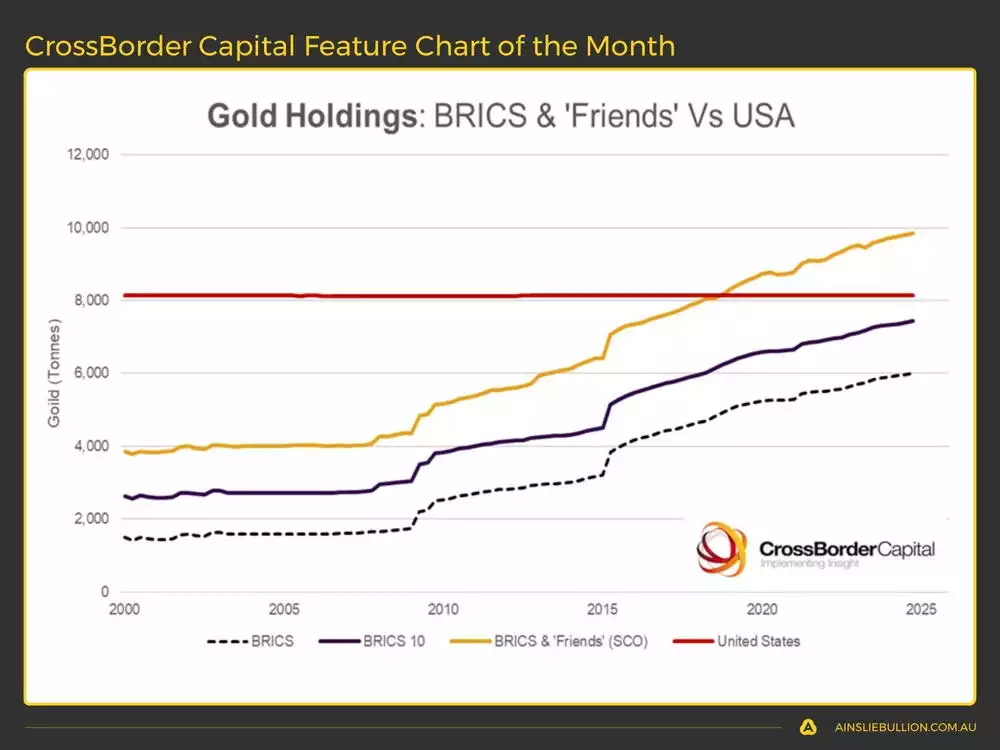
Central bank demand for gold continues to surge—particularly among BRICS nations and their “friends”—with holdings now eclipsing those of the U.S. in aggregate. As the charts show, these countries have steadily accumulated gold since the Global Financial Crisis, likely spurred by concerns over dollar weaponisation and the desire to diversify reserves. Meanwhile, gold and silver have posted impressive gains, but silver often lags until late in the cycle before making a strong “slingshot” move. The gold‐silver ratio (GSR), currently near historic highs, suggests a potentially compelling opportunity in silver if history repeats and the ratio compresses toward more typical levels. Given silver’s dual role as both industrial and monetary metal, and its smaller overall market size relative to gold, we believe it could outpace the yellow metal when liquidity truly accelerates.


A Simple Trading Plan to take advantage of the cycles
Watch the video presentation to see full details of the specific Trading Plan we provide, that you can follow, which has returned 241.0% p.a. as of Tuesday’s recording.
Watch the full presentation with detailed explanations and discussion on our YouTube Channel here:
This was our first full Macro and Global Liquidity Analysis report for 2025. We will return in February to assess what has changed and keep you updated with everything you need to know. Until then, good luck in the markets!
Chris Tipper
Chief Economist and Strategist
The Ainslie Group
x.com/TipperAnalytics
Note: The monthly video presentation is recorded live with our expert panel. Our objective is to make the updates as useful and specific to what you want to understand as possible, so as always feel free to reach out with any questions or feedback that we can incorporate into next month’s video to make it something that provides you with the highest possible value for your time!