Macro and Global Liquidity Analysis: Gold, Silver, and Bitcoin – April 2025
News
|
Posted 02/05/2025
|
17171
Today the Ainslie Research team brings you the latest monthly update on where we are in the Global Macro Cycle, driven by the Global Liquidity Cycle, and the implications for Gold, Silver, and Bitcoin. This summary highlights the key charts discussed with our expert panel on Wednesday. We encourage you to watch the recorded video of the presentation in full for the detailed explanations.
Where are we currently in the cycles?
This month, our perspective on market conditions remains cautiously optimistic, with a keen focus on the vital role global liquidity plays in shaping trends. Our analysis reveals that global liquidity is increasing, aligning with a period of economic expansion within the global macro cycle. Meanwhile, Bitcoin lingers in a short-term bear market. However, its price has surged back to well above US$90,000, hinting at a potential return to bullish territory in the near future. Despite widespread pessimism stemming from economic slowdowns and tariff uncertainties, the data suggests that much of this negativity is already factored into asset prices. Trends in liquidity point to a possible market bottom already being established, offering a brighter outlook than current sentiment might imply.


Deep dive on the Global Liquidity Cycle
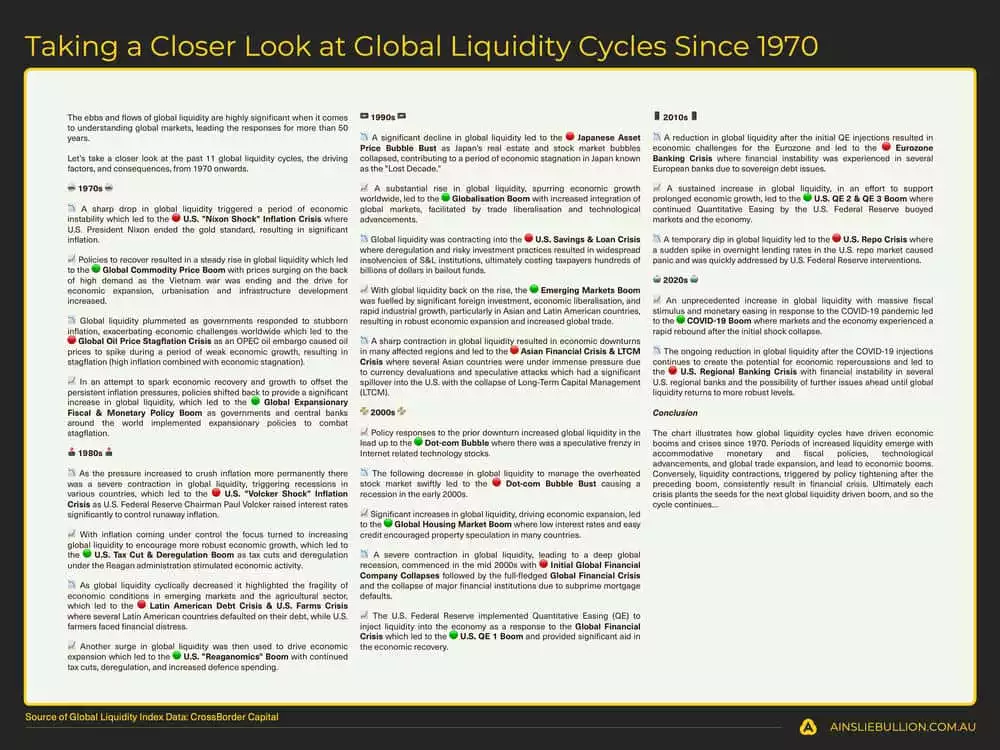
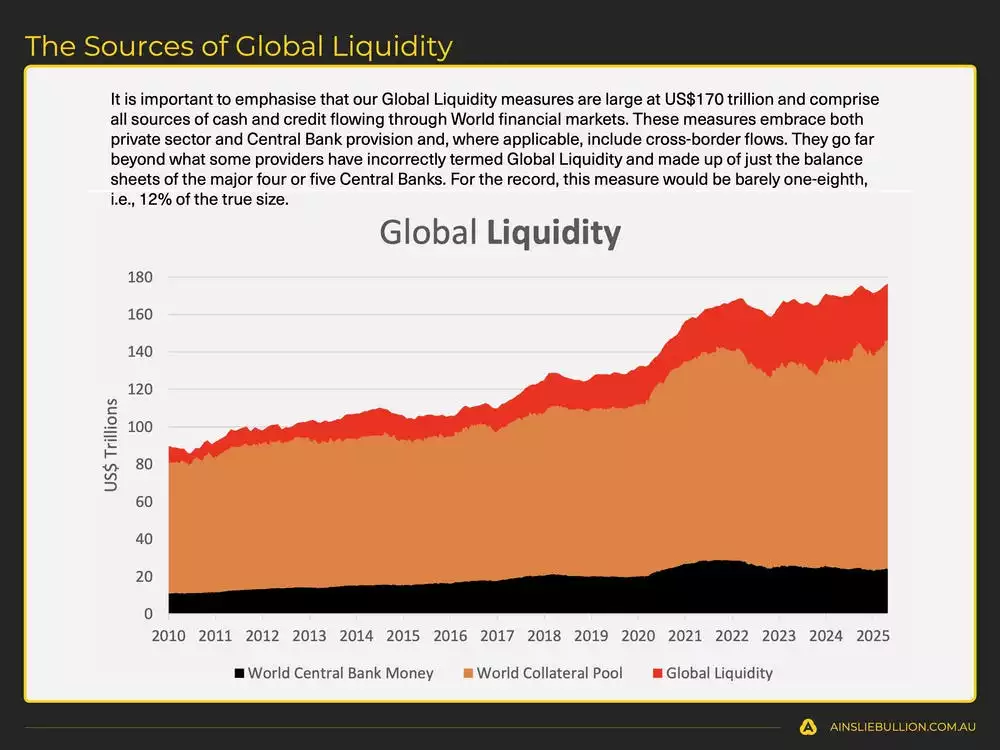
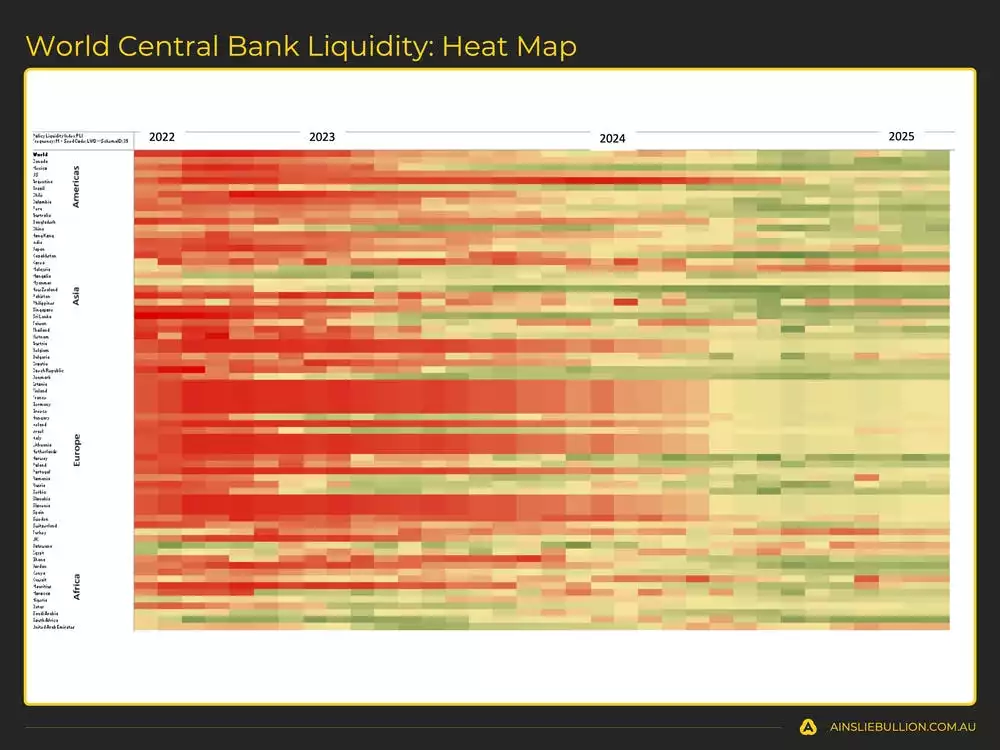
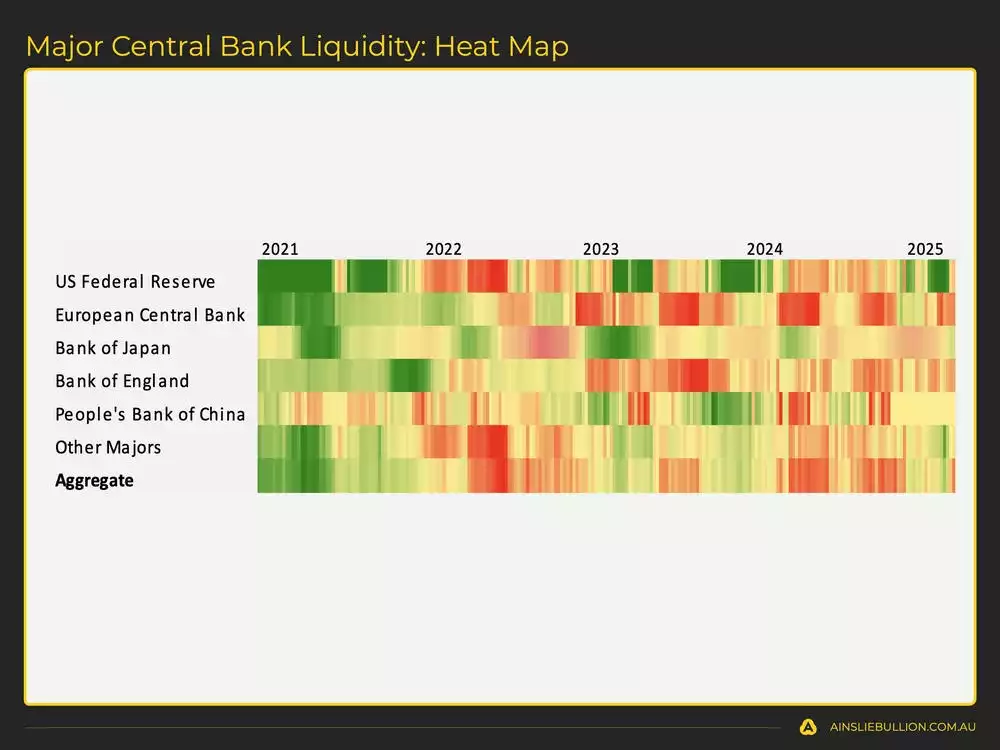
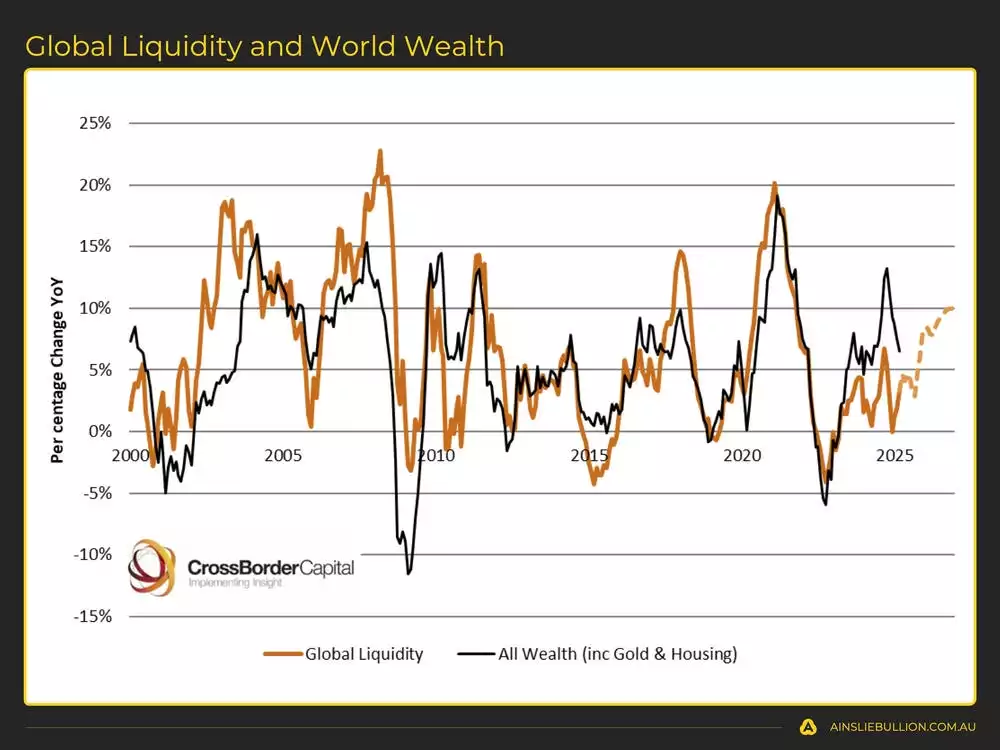
A closer look at the forces driving global liquidity uncovers the intricate link between financial cycles and market movements. The total liquidity pool, valued at US$170 trillion, is primarily fuelled by the global collateral pool, with central bank balance sheets making up just 12% of the total. Recent data reveals that liquidity has hit record highs, consistent with a phase of economic growth. Yet, major central banks, such as the U.S. Federal Reserve, are signalling a tightening of monetary conditions, despite past efforts to inject funds. History shows that surges in liquidity often spark economic booms—like during the COVID-19 recovery—while reductions tend to align with downturns, such as the Global Financial Crisis. Although the current trajectory is upward, short-term dips could arise from factors like tax-related withdrawals or an approaching US$7–9 trillion refinancing challenge. Still, the long-term trend is likely to remain positive, supported by ongoing debt issuance.



Deep dive on the Global Macro Cycle
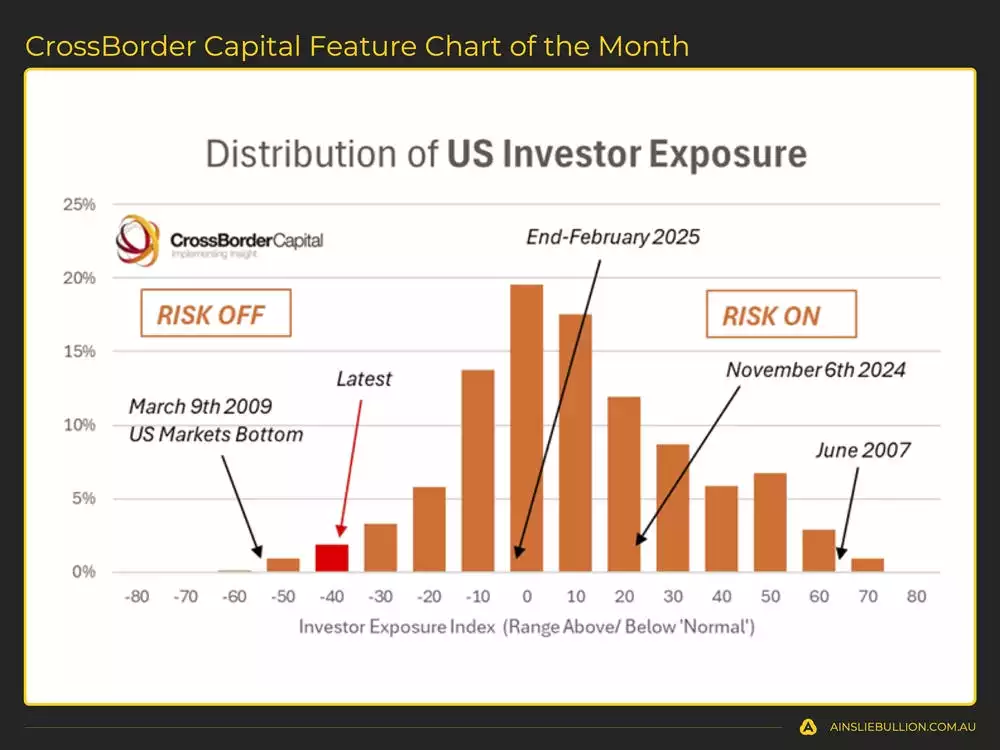
When we broaden our view of the economic factors influencing liquidity, several critical trends emerge within the macro cycle. The U.S. dollar has undergone notable depreciation, recently steadying around 98, which has eased the strain on the global collateral pool and boosted liquidity. Market cycles hint at a possible stabilisation, with the dollar potentially climbing to around 104—but likely not much higher—to avoid squeezing the entire financial system. Inflation signals are softening, with forward-looking measures suggesting reduced pressure, which could open the door to lower interest rates if economic growth slows further. Growth itself is faltering, as manufacturing and services PMIs dip below 50, indicating contraction. However, markets seem to have anticipated this weakening, interpreting adverse developments as a sign of forthcoming stimulus. U.S. government debt has soared to US$36.21 trillion, accompanied by volatile bond yields. Recent yield declines suggest some calm, possibly aided by mechanisms like new bond issuances, tweaks to banking leverage rules, and demand for short-term treasuries driven by stablecoins. Investor positioning also indicates expectations of future liquidity boosts, despite lingering uncertainties.



Deep dive on the Bitcoin Cycle
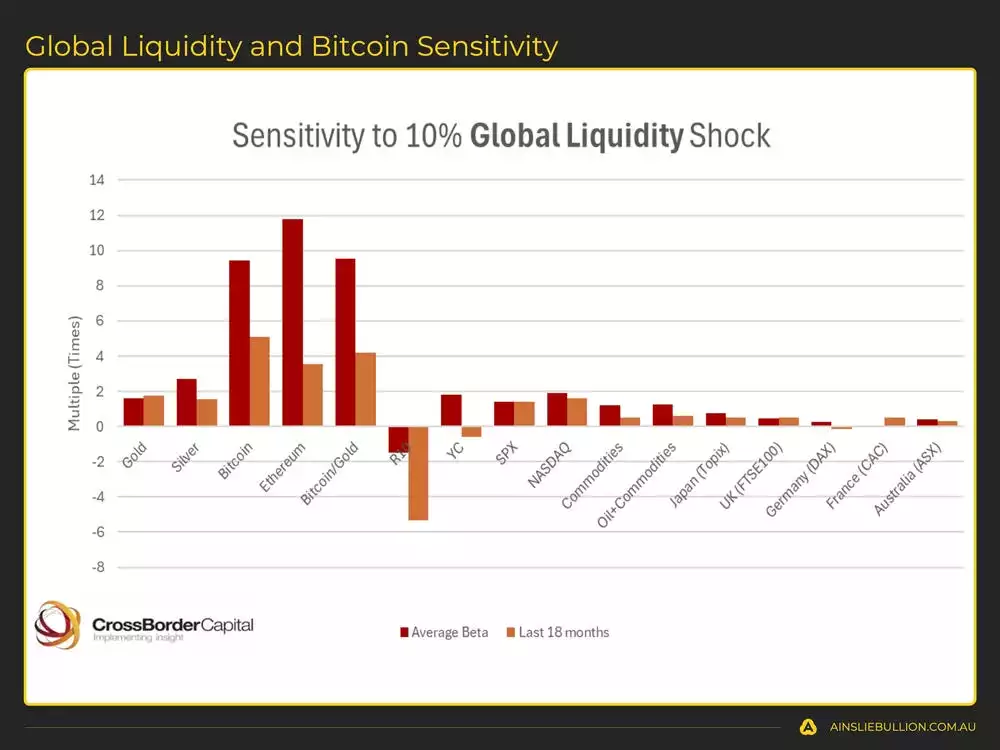
Turning to Bitcoin’s connection with global liquidity, its recent performance reinforces its status as a top hedge against monetary inflation amid improving global liquidity conditions. It has displayed impressive strength during this recent market recovery, mirroring historical patterns where assets like Bitcoin and gold outstrip the U.S. Consumer Price Index during liquidity upswings. Evidence points to Bitcoin’s heightened responsiveness to liquidity shifts, surpassing traditional assets like stocks. Its price tends to trail these shifts slightly, offering a forecasting window of four to eight weeks. Bitcoin’s growing independence from indices like the Nasdaq—currently weighed down by tariff worries—casts it as a cleaner investment option. The current 60-day Bitcoin cycle appears to have shed excess speculation, paving the way for a possible climb to back above US$100,000. While fresh record highs may still lie ahead, they’re bolstered by the upward momentum in global liquidity.



Gold and Silver
We can take advantage of the Macro Cycles by strategically allocating between the Macro Assets (Bitcoin, Gold, and Silver) during the optimal cycle stages.
Analysing gold and silver within the context of global liquidity paints a strong picture for precious metals as shields against inflation. Gold has enjoyed a remarkable rally, hitting new peaks month after month, driven by steady demand from central banks—acquiring roughly 1,000 tonnes yearly—and robust ETF inflows. The first quarter of 2025 saw the largest inflows since the COVID-19 era, topping 220 tonnes. Though gold sits 20% above its 200-day moving average—suggesting it may be overstretched—sustained buying, especially from China, implies any retreat could be shallow unless this demand fades. Silver, by contrast, emerges as a late-cycle contender, with its price rising alongside growing liquidity. The gold-silver ratio, now at 100:1—far above its typical range—flags a prime chance for silver to shine. Past trends show silver can double in value during ratio corrections; for example, in 2020, it soared over 100% while gold gained 40%. This potential makes silver an appealing choice for investors eyeing a shift of profits from gold.


A Simple Trading Plan to take advantage of the cycles
Watch the video presentation to see full details of the specific Trading Plan we provide, that you can follow, which has returned 193.8% p.a. as at Tuesday’s recording.
Watch the full presentation with detailed explanations and discussion on our YouTube Channel here:
We will return in May to assess what has changed and keep you updated with everything you need to know. Until then, good luck in the markets!
Chris Tipper
Chief Economist and Strategist
The Ainslie Group
x.com/TipperAnalytics
Note: The monthly video presentation is recorded live with our expert panel. Our objective is to make the updates as useful and specific to what you want to understand as possible, so as always feel free to reach out with any questions or feedback that we can incorporate into next month’s video to make it something that provides you with the highest possible value for your time!