MUST READ – Paying for Easy Money – The US Fiscal Ponzi Scheme
News
|
Posted 12/11/2021
|
10772
So what’s the best thing you could do to ease multi-decade-high inflationary pressures and record high ($29 trillion + $159 trillion unfunded) debt burdens if you were the US Government? Approve a $1 trillion deficit funded infrastructure plan of course! This week saw exactly that happen and on Monday Joe Biden will sign the largest federal investment in infrastructure bill in over a decade. Moreover, in securing the deal he got Democrat support too for ANOTHER $1.75 trillion for the Build Back Better bill (social safety net and climate package) and a commitment to railroad it past the Republicans in the senate.
2.75 thousand billion dollars paid for, not through tax receipts, but by issuing more debt with the disarming name of US Treasury bonds… let that sink in. With the Fed supposedly stepping away from the QE bond buying plate one must wonder who in their right might would buy all that debt? If buying is slower and yields rise, how does the Government service the interest cost on all that debt? It already spends over $370 billion on interest payments or over 9% of all tax receipts. It’s debt to GDP is 130%! The US is looking at the double whammy of running a fiscal deficit ($2.8 trillion already) and trade deficit ($1.0 trillion).
And so, while monetary stimulus via QE is easing, fiscal stimulus is taking the baton and sprinting toward the cliff in its place.
Is it any wonder gold is on the move? The abuse of the USD is currently of an unprecedented order. There simply must be a run to under-priced liquid hard assets such as precious metals. As usual, few can explain things better than Crescat’s Otavio Costa and we include in full below his tweet threat from a couple of days ago. It is a must read to bring all of the above into focus.
“The government has been flooding the market with issuances of longer maturity instruments at unprecedented levels. The amount of outstanding marketable bonds and notes have increased by $626 billion in the last three months.
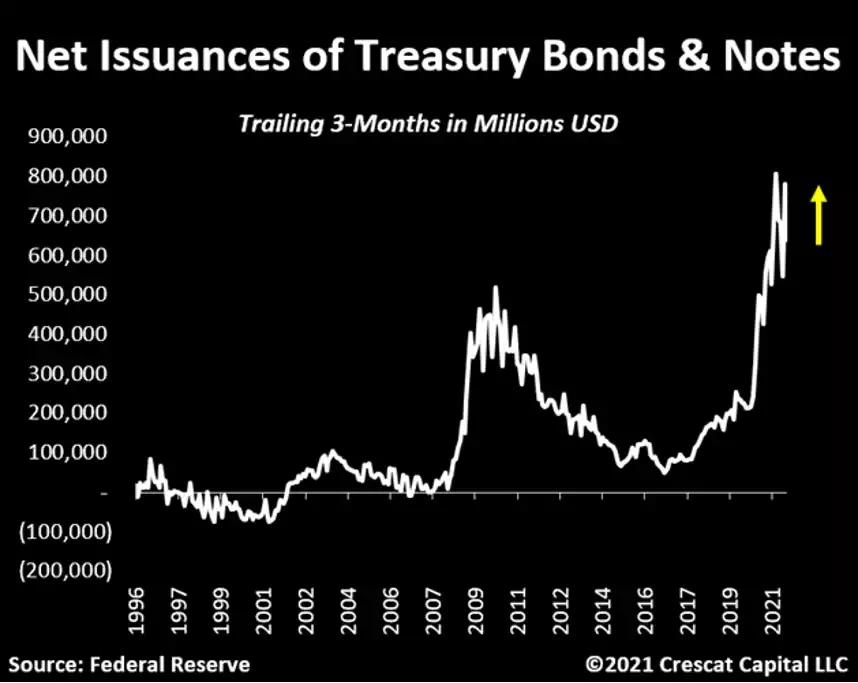
There is a significant shift underway in the composition of debt maturities issued by the US government that could profoundly increase the supply of long duration Treasuries.
The timing is particularly important as we are experiencing a macro regime change that is an abrupt reversal of a four-decade trend of disinflation in the most financially repressive moment in history.
More importantly: It also coincides with the Fed, the largest buyer of Treasuries, planning on drastically reducing its net new purchases and cease them altogether eight months from now.
While we did not see this level of debt issuances last year, this has been happening all year. On average, the government has net issued close to $220 billion per month of bonds and notes.
To understand the reason behind this surge in issuances, it is important to go back and analyze how policy makers initially funded the massive fiscal operations when the pandemic started.
From March to June 2020, government debt increased by $2.7 trillion and 90% of this amount was issued through T-Bills which are less than one-year maturity instruments. Such a large short-term issuance is not unusual in times of financial market stress.
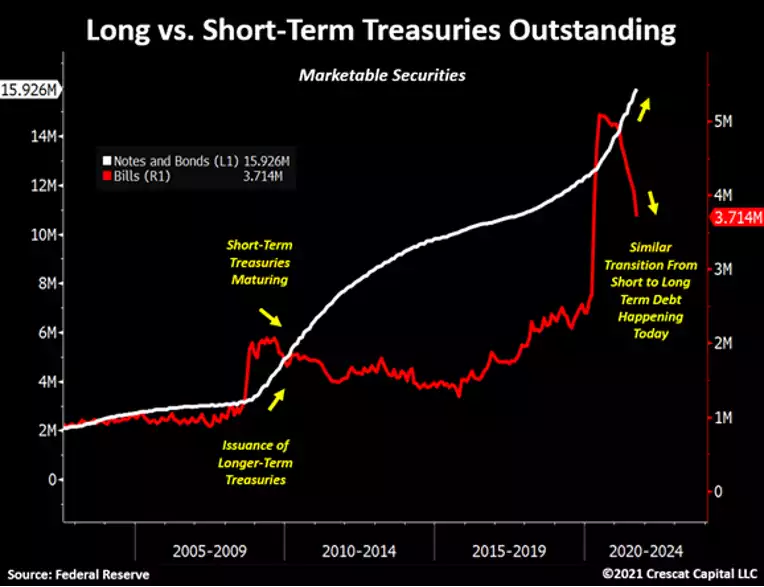
During a liquidity crunch, the demand for short duration, safer assets increases, making it significantly easier for the market to absorb these newly issued Treasuries to fund immediate fiscal stimulus measures.
We saw a similar development during the global financial crisis. From June to November 2008, the government funded 94% of its $1.1 trillion of debt increase through T-Bills.
However, back then, these shorter-term instruments matured and, rather than rolling them, the government issued bonds and notes to extend the maturity of its debt outstanding. This transition is precisely what is happening today.
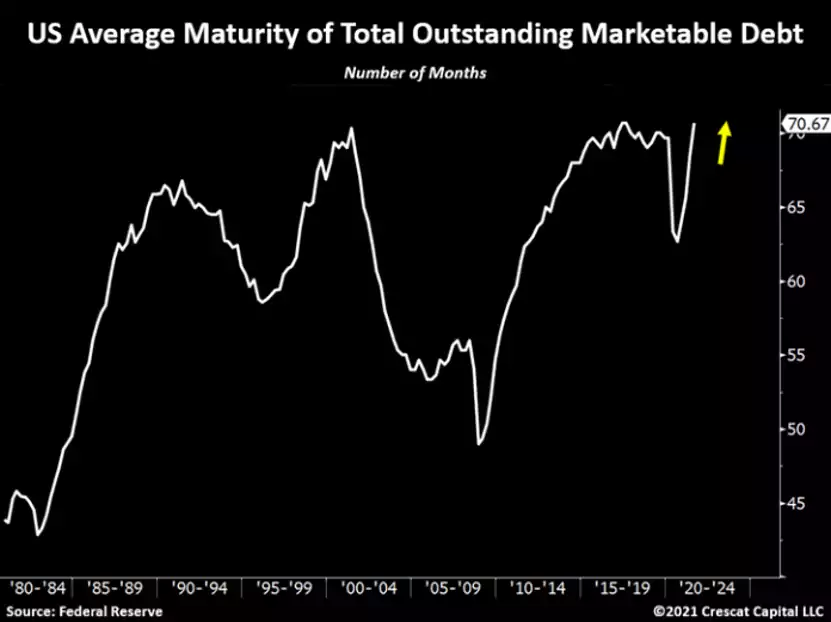
Note however, how the average maturity of total marketable debt outstanding is already near record levels today. We think the index below is likely to move significantly higher from here.
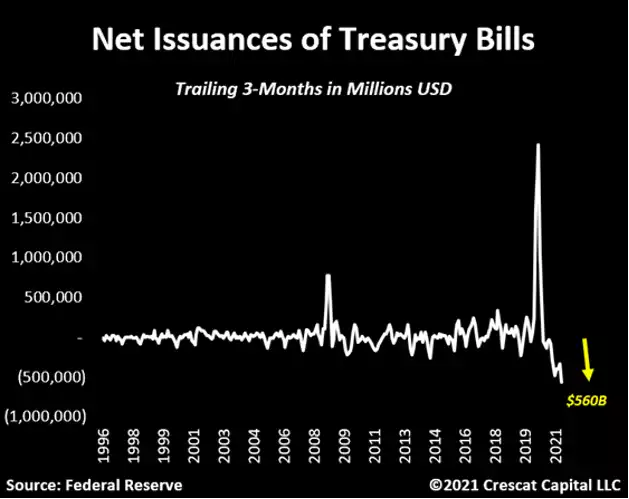
In the last three months, we have seen over $560 billion of short-term government instruments mature. This is the largest decline in outstanding T-Bills ever recorded in history.
With the largest imbalances yet in both overall debt to GDP and financial asset valuations, the levitation of the entire equity and fixed income markets, and the stability of the economy, have become dependent on maintaining ever lower interest rates in the US Treasury market.
10yr yields started the year around 0.9% and are now near 1.6%. That interest rate increase happened over a time period when the Fed was buying close to 35% of the net new issuance of Tsys. We expect even more upward pressure on rates because of the Fed’s planned tapering.
The Fed has always been trapped, but this time it is as trapped as it could possibly be. We worry that the Treasury market is about to face one of its largest supply and demand mismatches in history.
As a result, we think this imbalance could cause 10-year yields to rise as high as 2.5 to 3% or more. If this move materializes, the yield curve control narrative will become as prevalent as ever.
It is the first time in many decades that developed economies are having to choose between reducing monetary stimulus due to rising inflation vs. adding further liquidity to cope with a decelerating growth.
Inflationary conditions are forcing policy makers to pursue an impossible mission: Tighten financial conditions just enough so risky assets stay afloat without inflation getting out of control.
We all know how it ends. Inevitably, a financial shock is triggered, and central banks must resort back to liquidity measurements. Also, separately, do commodity markets even care if 10-year yields are at 2.5 or 3%? Probably meaningless.
The inflation genie is already out of the bottle and a mere increase in interest rates would still put today’s financial conditions among the most repressive in history.
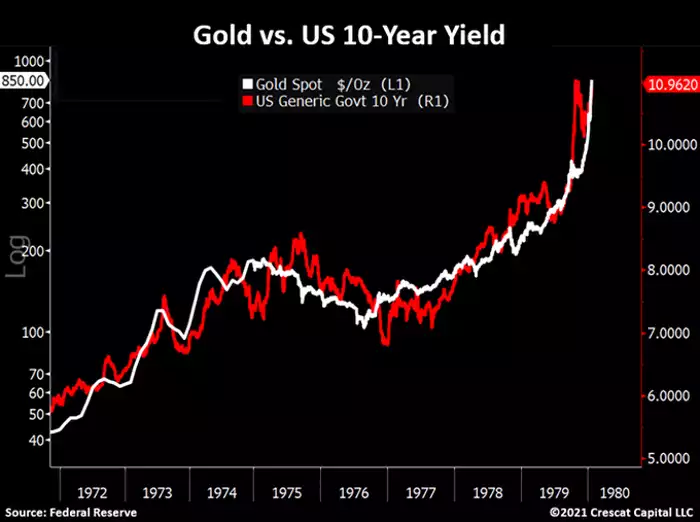
Then what happens with gold if long-term yields are poised to rise? Let’s use the 70s as an example. Nominal yields trended higher and gold followed along almost perfectly.
By looking at the Eurodollar curve, the market already expects the Fed to be raising rates to 1.25% in the next two years.
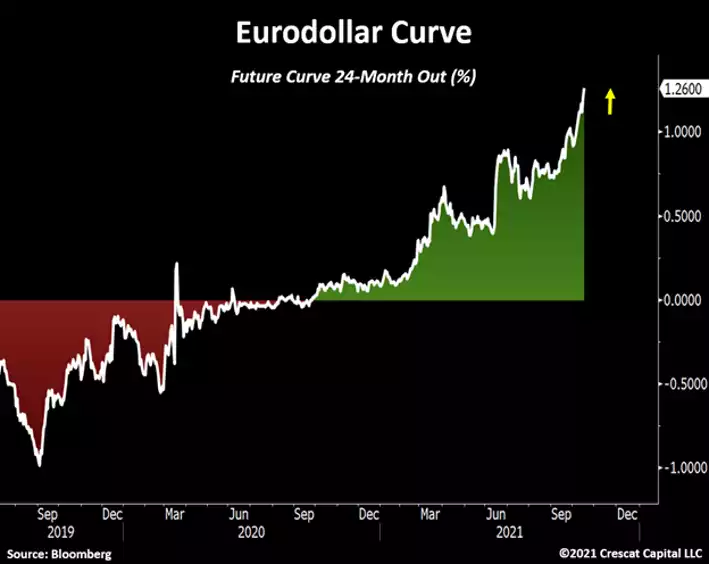
If policy makers would pursue that as a plan, the Treasury curve would almost certainly invert today, triggering a recession signal. It is necessary for the Fed to allow long-term yields to rise to even consider hiking short-term rates.
Today’s interest rate policy is perhaps most aggressive interest policy we have ever seen. Considering where the GDP growth, inflation and unemployment rate is today, the Taylor rule baseline model suggests that the Fed funds rate should be at 9.3%.
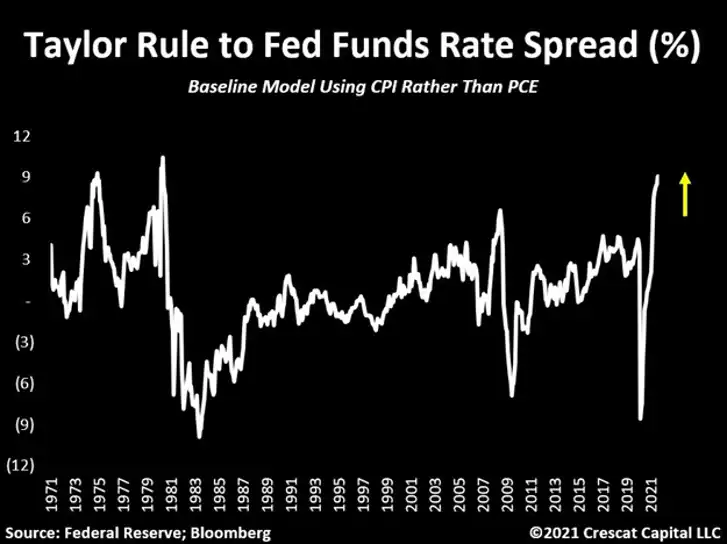
Keep in mind: This calculation presumes CPI is an accurate measurement of inflation, which we obviously do not believe this holds water.
We think the YoY growth in inflation is at least low double digits, and if correct, we are indeed living in the most financially repressive environment in history.
Aside from what is happening on the monetary policy side, massive fiscal spending continues to pressure the government to dig an even deeper debt hole.
As we have previously mentioned, the fiscal agenda has four well-defined and long-lasting fronts: The Green Revolution An Infrastructure Revamp Peak Inequality A Fiscal Arms Race with China In our opinion, these political efforts significantly feed into the inflation thesis.
Additionally: While on one side, government spending clearly has no end in sight, on the other side, the US trade balance is deteriorating.
Just in the last twelve months, the US had net imports of over $817 billion. The twin deficit (current account + fiscal) is now close to 15% of nominal GDP, almost three percentage points lower than the worst levels of the Global Financial Crisis.
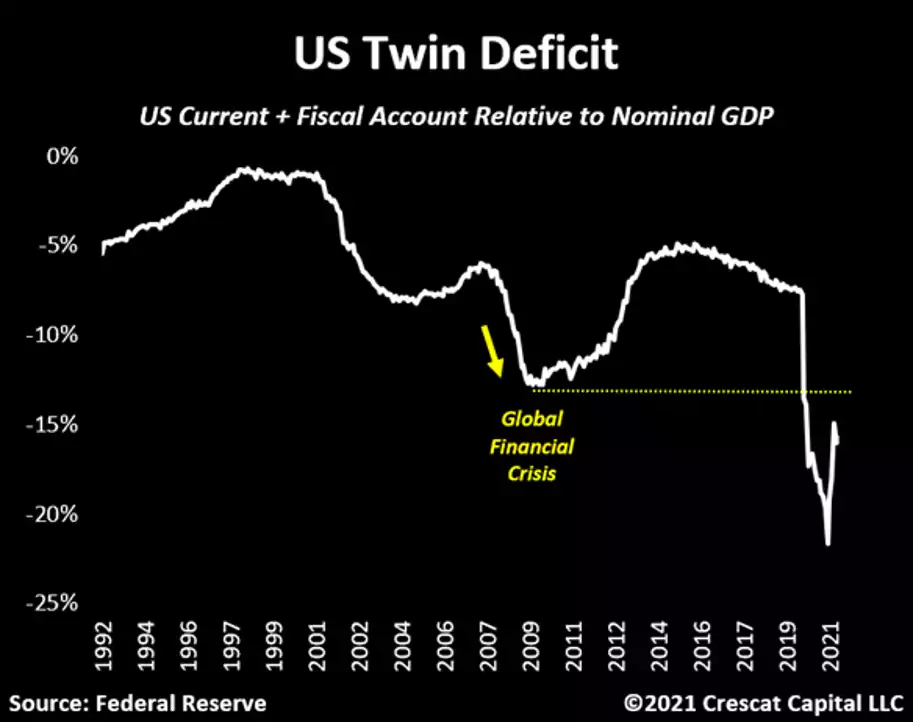
We now have an explosive mix of fiscal and monetary excess coupled with long years of declining capital spending in primary resource industries that could unleash a combination of high inflation and negative real economic growth at levels that we have only experienced in the 70s.
Economic deceleration is likely coming from Asia and spreading to the rest of the world. We are now seeing a significant number of negative surprises in the macro data relative to estimates.
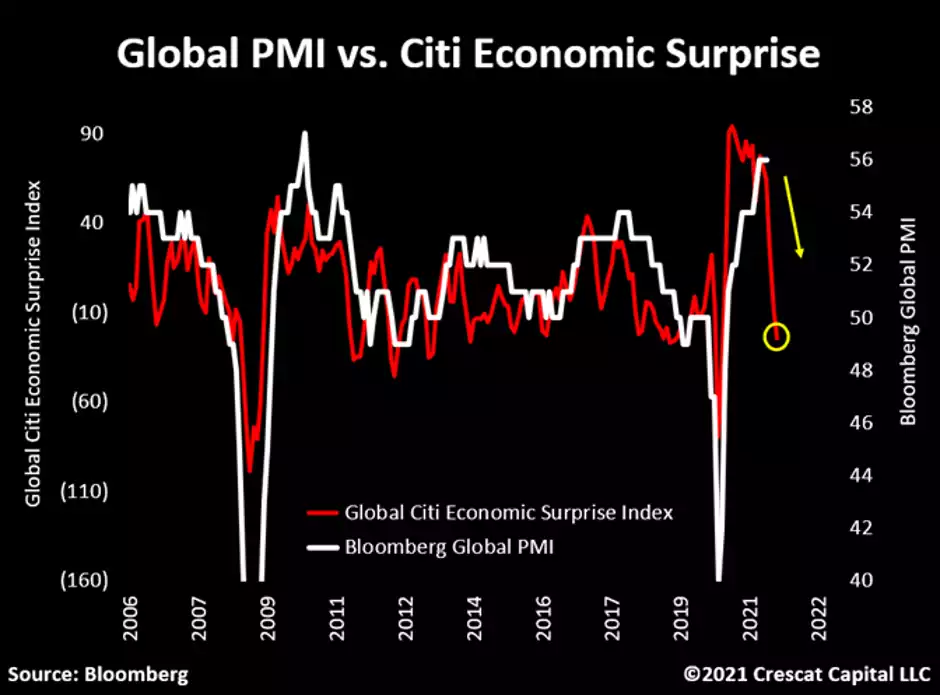
As a result, the Global Citi Economic Surprise index is now plunging, suggesting that global PMIs should follow to the downside.
So now I ask: If economic growth continues to decelerate while inflation remains historically elevated, what will the Fed do? The set of monetary and fiscal policies needed to fix one problem would worsen the other. None of us own enough hard assets.”