Liquidity Conditions Brewing for a Blow Off Top Rally
News
|
Posted 10/07/2025
|
1478
As Trump continues to pressure the US Federal Reserve for rate cuts, equity markets appear poised for a final “blow-off” rally—regardless of any imminent policy shifts—before a broad-based financial crash.
This pattern aligns with the historical land cycle, which averages 18.6 years between major crashes, with the Global Financial Crisis (GFC) marking the last. The final phase of these cycles has typically seen markets rise together in a liquidity-fuelled uptrend—followed by a sharp collapse where few assets perform well, aside from precious metals.
Current conditions suggest the necessary liquidity and leverage are building for this final rally, underpinned by complacency, speculative excess, and growing systemic fragility.
US Bond Markets
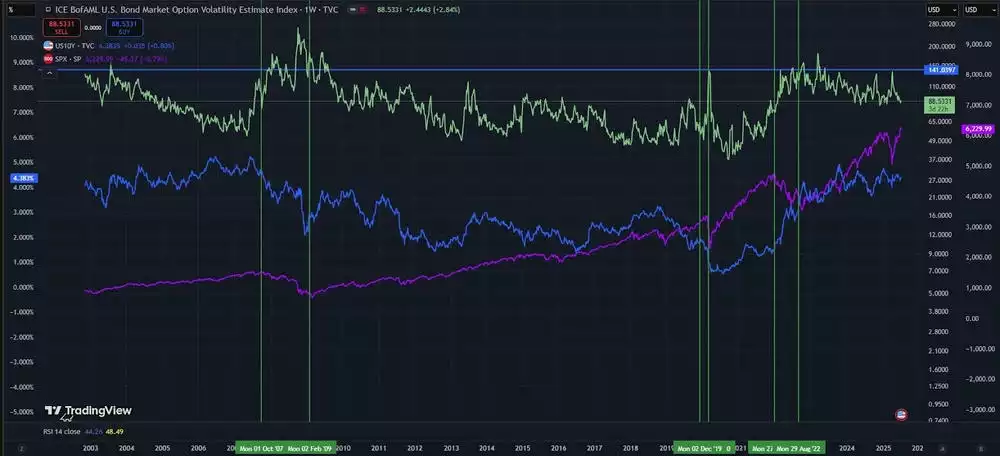
While the US 10-year yield has yet to decisively roll over, bond market volatility remains in a clear downtrend. This drop in volatility quietly supports global liquidity and, by extension, risk assets.
A similar setup occurred leading into the GFC: the US 10Y yield (blue) remained elevated while bond market volatility (green) trended lower—fuelling the S&P 500 (purple) into the peak of the previous land cycle.

Today’s market mirrors this phase closely: bond yields remain elevated, volatility continues to fall, and the S&P 500 has posted new highs.
The ideal backdrop for a broad market blow-off would include falling bond yields, falling interest rates, and continued low volatility. Currently, only one of these conditions is met—but could all three align to propel a euphoric market top?
Whether or not the Fed cuts rates will be influenced by the US 10Y chart, which reflects broader inflation expectations.
US Interest Rates
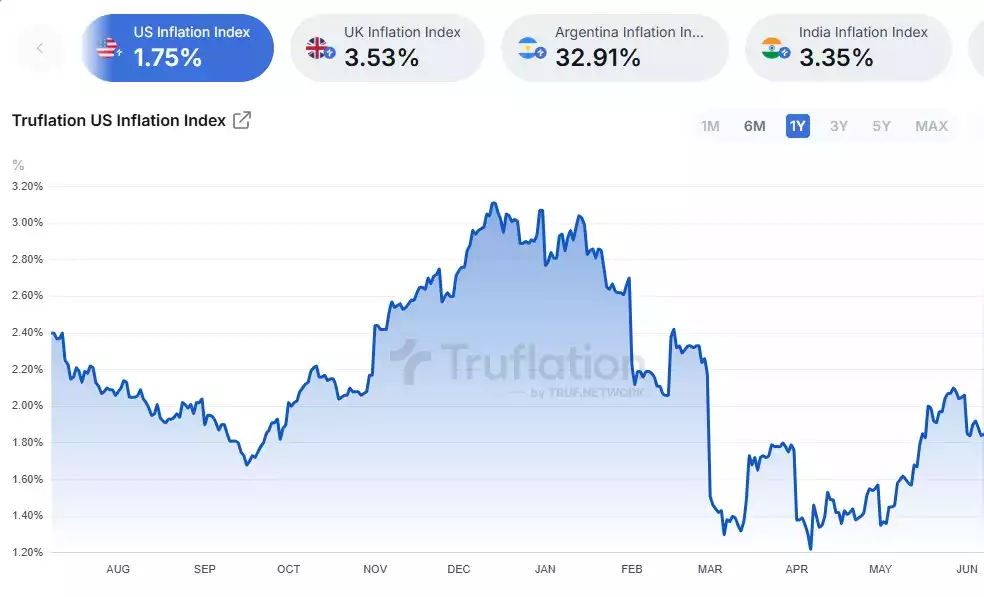
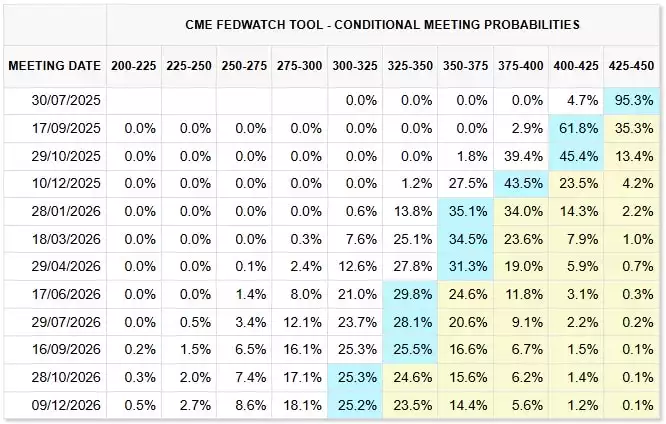
Currently inflation is continuing to trend down, with the market expecting rate cuts in September.


While these expectations remain fluid, a meaningful decline in the US 10Y before September would all but cement this outlook. Should bond yields, rates, and volatility all fall in tandem, risk markets could see a sharp rally.
DXY
Several weeks ago, the US Dollar Index (DXY) broke below its macro 50% level. Since then, it has retested and been strongly rejected at that level, with the broader downtrend intact.
 1 Week Chart - July 2025.jpg?ver=YuMUVsov8-QOpUlN8YgbdA%3d%3d)
While DXY can rise alongside risk markets—particularly when the Yen is weakening due to cheap yen-denominated debt expanding global liquidity—ideal conditions would see both DXY and the Yen fall together, supporting a liquidity-driven rally.
Risk Appetite
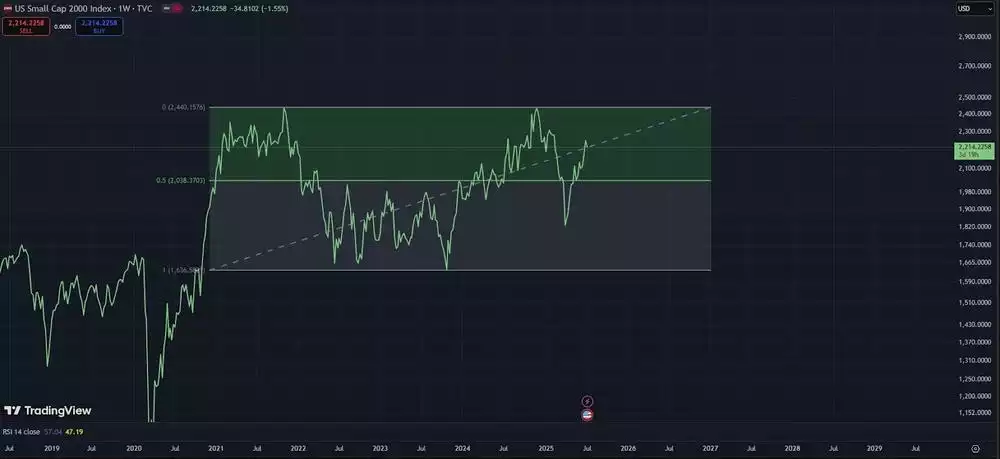
We continue to track the Russell 2000 as a barometer of investor risk appetite. A rising Russell indicates a shift towards more speculative sentiment, particularly in small-cap equities.
The Russell 2000 is showing strong momentum. After a sharp decline during the tariff-driven sell-off, it has regained and held above its macro 50% level—now trending higher.

A “perfect storm” scenario for markets would include falling DXY, a weaker Yen, and declines in bond yields, volatility, and interest rates—amplifying investor complacency and leverage-driven speculation. While we may not get all these conditions, several are already in place. The bond market remains the key area to watch.
From a land cycle perspective, a blow-off top driven by greed and speculation—followed by a systemic financial collapse—is not only plausible, but historically consistent. We are likely already in the late stages of this cycle, where volatility will surge in both directions, and sentiment will swing accordingly.
Gold and silver have historically risen into this final rally—and crucially, have continued to perform well post-collapse, while other assets languish for years. Investors would do well to heed these historical signals as the current cycle matures.
Watch the insights video inspired by this article here: https://www.youtube.com/watch?v=4Gtysfzf63g