Is Silver Entering 35 Years of Price Appreciation? The 100-Year Silver Cycle
News
|
Posted 31/10/2024
|
3917
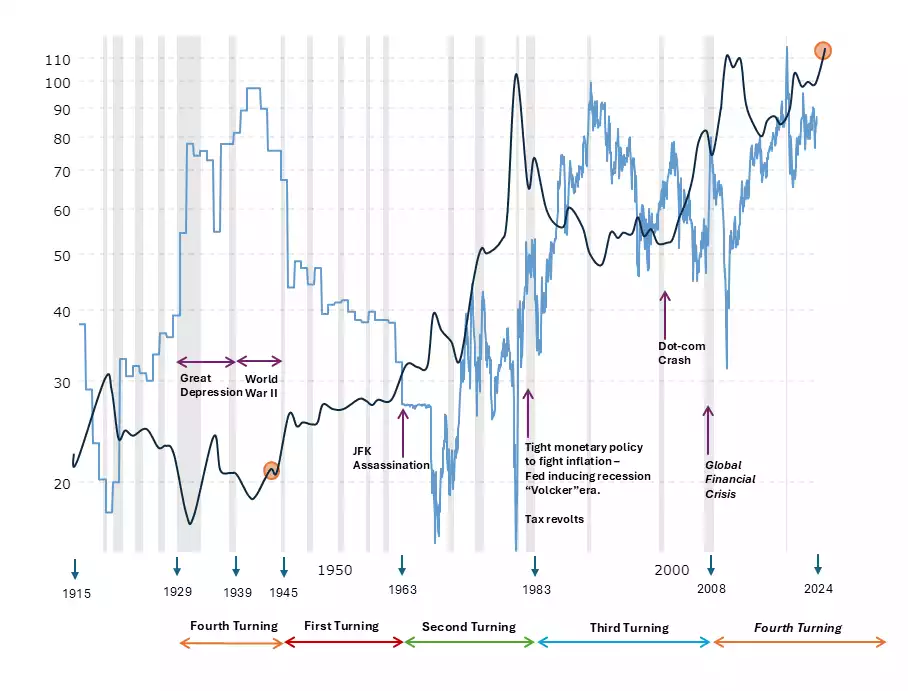
The chart below shows the silver USD price overlaid on the gold-to-silver ratio over the 4 turnings of the past 100 years.

Toward the end of the previous 4th turning, we saw the silver price break out of a bullish accumulation pattern and then proceed to go on a 35-year long bull run over the 1st and 2nd turning of the next macrocycle - while the GSR fell off a cliff over the 1st turning and bottomed over the 2nd turning.
The “Four Turnings” thesis, formulated by historians Neil Howe and William Strauss in 1997 suggests that society moves in 80-year macrocycles made up of four sub-cycles, each lasting about 20 years - called “turnings”. Every turning has its own generational archetype, specific role, and predictable result.
First turning - involves the rise of powerful institutions. It is a time of hope and optimism, focusing on growth and prosperity.
Second turning - we see a rise of individuality and the institutions established in the first turning start facing opposition.
Third turning - individualism is truly alive, and institutions are perceived with increasing distrust. The focus here is on the self; and on having fun. This phase involved tax cuts, low interest rates, and financial overconfidence - leading to increasing inflation and government deficits - which moved us into the next phase.
Fourth turning - is defined by war and revolution. Institutions are torn down and rebuilt for the sake of a nation's survival. Once the prevailing crises are overcome, society finds a sense of communal direction, unity, and common purpose into the first turning of the next 80-year cycle.
The gold-to-silver ratio tells us how many ounces of silver give us one ounce of gold. When this ratio is high, silver is undervalued, as priced in gold.
The active precious metal investor will buy silver when the ratio is high - with the view of trading it in for gold as it reduces.
In the chart presented we can note the following about the silver price and the GSR -
4th turning (1929-1945) - GSR is topping. Silver price is experiencing a bullish breakout.
1st turning (1945-1963) - GSR has a sharp drop off. Silver price has a steady rise.
2nd turning (1963-1983) - GSR is bottoming (below 20!). Silver price is going parabolic.
3rd turning (1983-2009) - GSR has a sharp rise. Silver moves into a bullish accumulation pattern (cup and handle).
4th turning (2009 - current) - GSR is topping. Silver price is experiencing a bullish breakout.
As we transition from one 80-year cycle to the next 80-year cycle, from the old world into the new, amid societal changes, chaos, and financial collapses, the gold to silver ratio drops off at a scale, unseen for 100 years while the silver price goes into a multi-decade price appreciation phase.
During times of crisis, investors seek safe haven assets to get shelter from the storm. Assets not connected to any government or financial institution, with a proven track record over millennia such as gold and silver. This causes a significant price increase in both gold and silver, leading to the crisis, with gold outperforming silver, initially.
However, after the crisis as gold and silver have been increasing in value while most other markets are collapsing the average retail investors start truly believing the precious metals bull run which drives speculation.
With a smaller market capitalisation and lower liquidity, this speculation causes serious price increases in silver causing silver to lead the way, subsequently outperforming gold, causing the gold-to-silver ratio to reduce.
This is an opportunity to simultaneously capture significant capital growth while securing a hedge against systemic collapses as we move from one global system into the next.
Today, as we find ourselves towards the culmination of a 4th turning, both the GSR and the Silver USD price setups are eerily similar to the culmination of the previous 4th turning. With the GSR putting in a topping pattern, and silver gearing up for a break out from a bullish accumulation pattern.
With an expected end to this 4th turning by around 2030, we look forward to the next macro 80-year cycle, can we expect silver’s performance in the upcoming 1st and 2nd turnings (2030-2070) to rival the previous 1st and 2nd turnings (from 1945-1985)?
With nations stockpiling gold and silver, greater industrial use cases for silver than ever before, and a transition from the current U.S. dollar-dominated financial system to a new world, it certainly seems reasonable to speculate so.
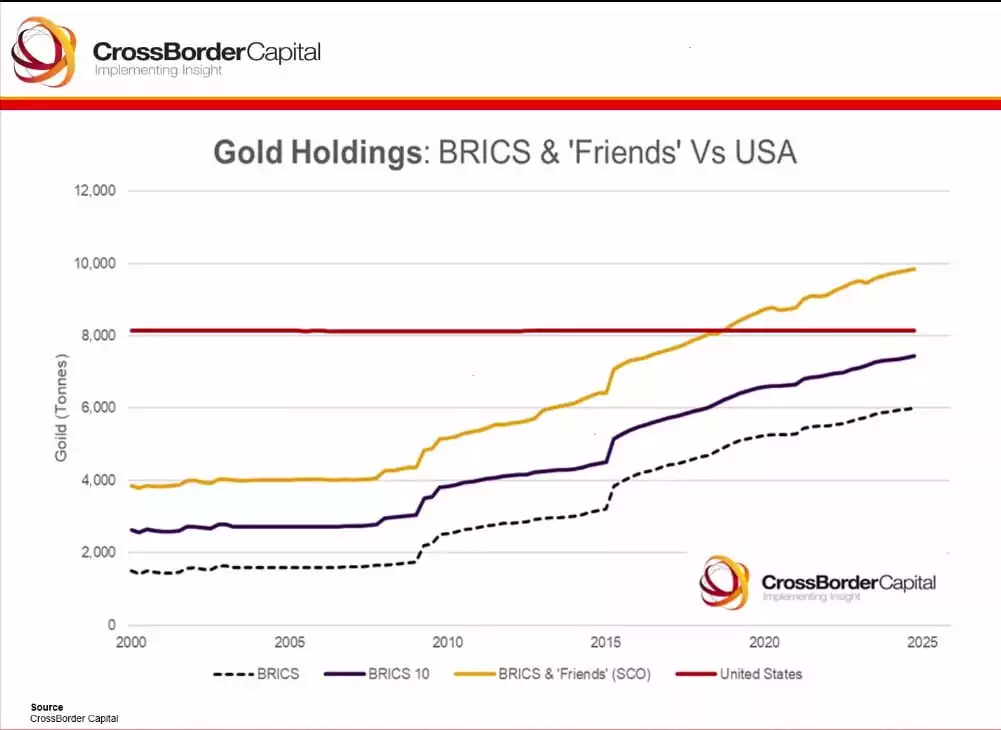
The chart below shows the BRICS nations stockpiling Gold.

While gold is currently outperforming silver and the GSR is putting in its topping pattern in this 4th turning, silver will soon enough take centre stage when this ratio falls off a cliff in the 1st turning that follows.
With China purchasing silver directly from miners as silver concentrates at a fixed price, and with a shortage of over a billion ounces of silver from the past 5 years of excess silver demand outweighing supply. One can expect tighter liquidity in silver markets as we lead into the first turning further strengthening the view of the GSR falling off, into the next 80-year macrocycle.
If we see a centennial drop off on the GSR, coming into the 1st and 2nd turnings with silver gaining value against gold, one can only imagine what silver will do against the dollar during this time.
As we approach the close of the fourth turning, we are on the lookout for a once-in-a-century drop-off of the Gold to Silver Ratio accompanied by a 35-year-long bull run for Silver, against the US dollar.