IGWT 4 – Gold’s Technicals Looking Good
News
|
Posted 16/04/2019
|
8594
Over the last few days we have looked at a few of the tailwinds for gold looking forward from the In Gold We Trust preview. Today we pass on their assessment of the status quo for gold; where we are at now.
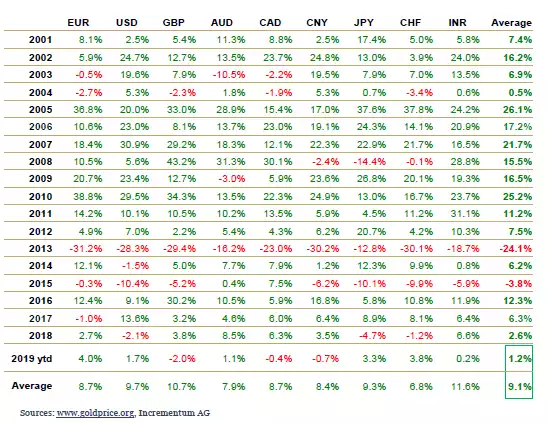
The table below shows gold’s performance over this century in a host of different currencies. As they say:
“The average annual performance from 2001 to 2019 has been +9.1%. During this period gold has outperformed practically every other asset class, and in particular every currency, despite intermittent, sometimes substantial corrections.”
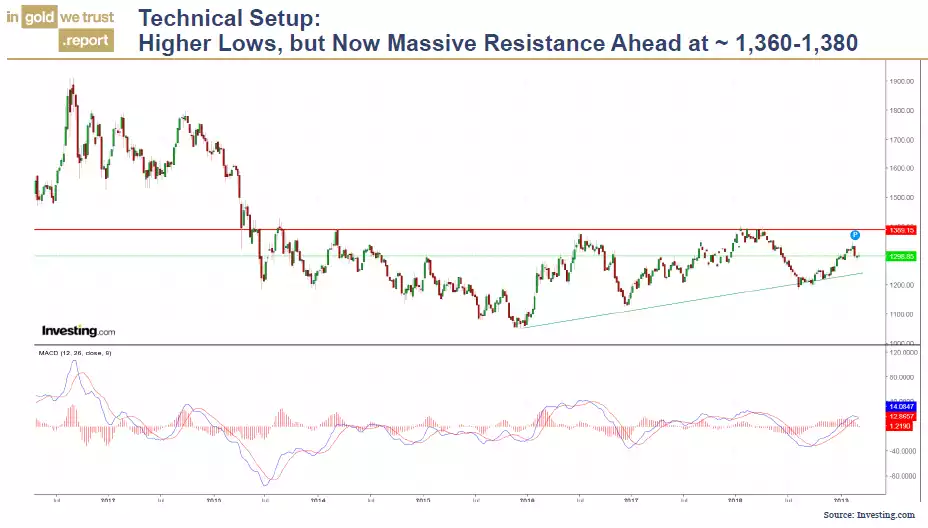
They then present a couple of bullish technical charts for where we are now:
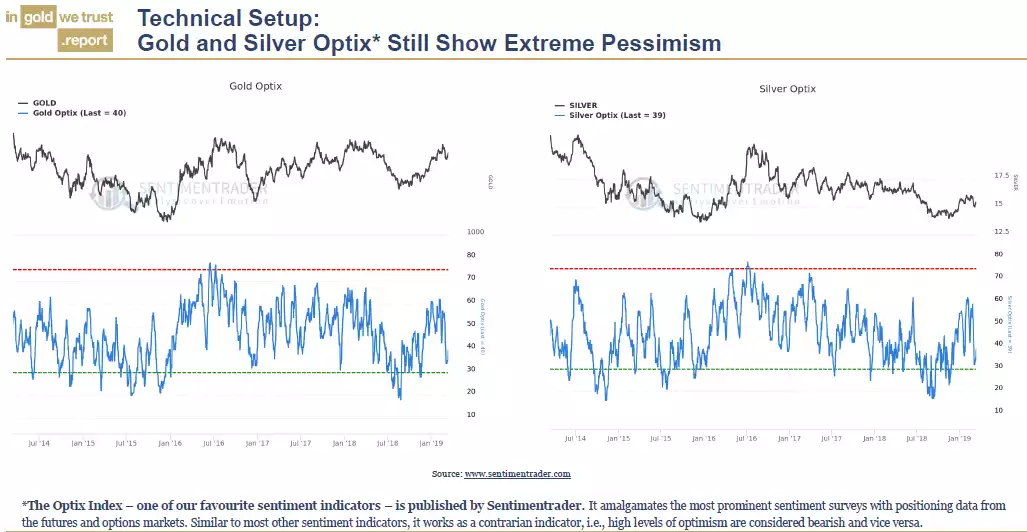
Combined with the ultimate contrarian indicator….
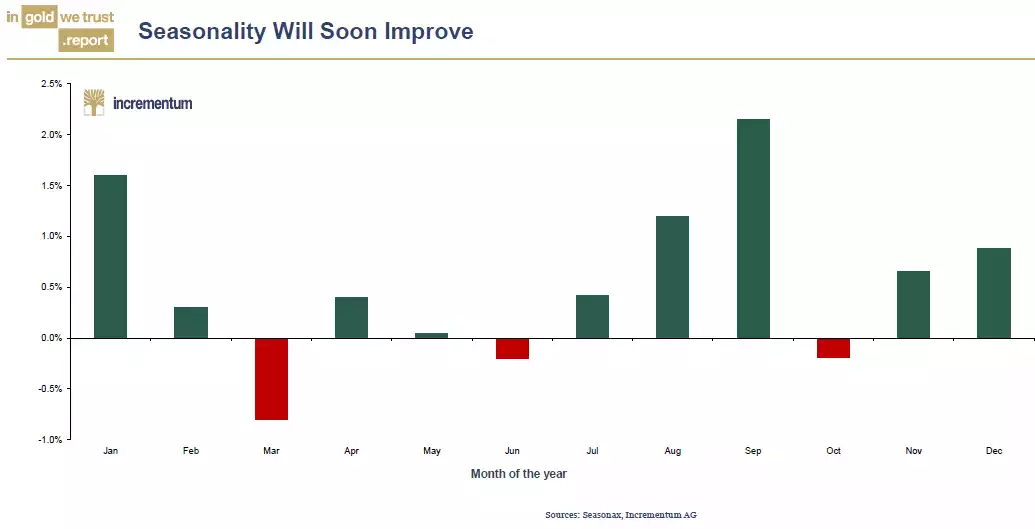
And historical seasonality indicating we have better times ahead:
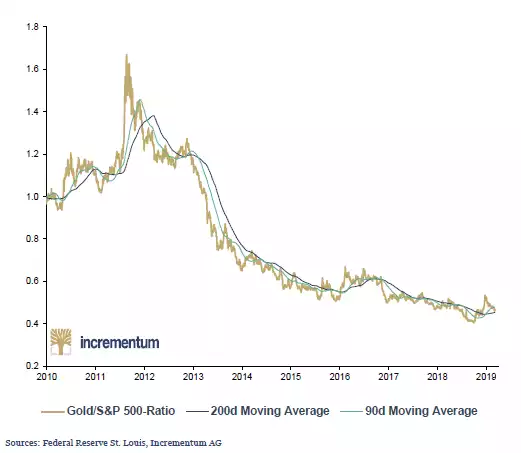
And finally, measured against the S&P500, gold is looking poised for good things:
“We consider the bull market in equities as the biggest opportunity cost for gold. Comparing the gold price to S&P 500 development, we can see that the relative performance of gold vs. the S&P 500 is bottoming. After seven years of underperformance of gold vis-à-vis the broad equity market, the tables might soon be turning in favour of gold.”