How the MVRV Ratio Can Help You Predict Tops and Bottoms
News
|
Posted 28/02/2023
|
12159
The MVRV Ratio is a highly popular and frequently used on-chain metric in the cryptocurrency industry. However, despite its widespread usage, there is additional potential within the MVRV ratio that is not commonly explored. The MVRV Ratio is commonly used to investigate Bitcoin market cycles and is particularly useful for identifying tops and bottoms in the market. The metric is highly nuanced, offering rich information for those who can fully understand and interpret it.
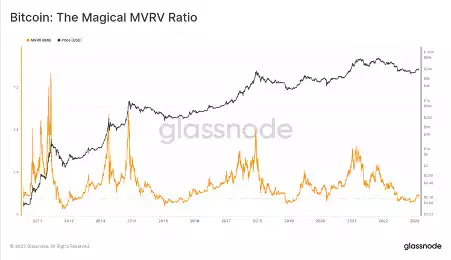
MVRV, or Market Value to Realised Value, is a metric used to compare the current price of a cryptocurrency to its average price when last moved on-chain. This metric is useful in measuring the amount of unrealised profit or loss held within a coin's supply.
- An MVRV of 2.2 means the price is 2.2 times the realised price, indicating 120% profit.
- An MVRV of 1.0 means the price is equal to the realised price, indicating a break-even point.
- An MVRV of 0.8 means the price is 0.8 times the realised price, indicating a 20% loss.
The MVRV chart displays the ratio over time and highlights the periods of extreme unrealised profit (bulls) and loss (bears).
- High MVRV values (above 2.4) indicate the market holds large unrealised profits.
- Low MVRV values (below 1.0) indicate the market holds unrealised losses.

A chart in oscillator format can help to visualise MVRV periods that are below 1, which indicates that the average Bitcoin holder is underwater and that the average coin was acquired above the current spot price. This phenomenon typically occurs during the later stages of prolonged bear markets, which can lead to widescale capitulation events. However, these events have historically been associated with the formation of cycle lows, suggesting that they can serve as a signal for investors to buy Bitcoin at a discounted price.
Determining what constitutes high and low values of MVRV can be difficult, and accurately identifying extreme deviations associated with cycle tops and bottoms requires a more robust approach than simply eyeballing levels. One visual approach is to mark MVRV levels at 0.8, 1.0, 2.4, and 3.2, which appear to align with tops and bottoms. However, to master MVRV analysis, it is essential to employ more advanced statistical methods and tools that can provide a deeper understanding of the data and help identify trends and anomalies that may not be immediately apparent.
MVRV levels can be quantified in terms of the likelihood of breach:
- Extreme Lows: MVRV has been Below 0.8 for approximately 5% of trading days.
- Getting Low: MVRV has been Below 1.0 for approximately 15% of trading days.
- Getting High: MVRV has been Above 2.4 for approximately 20% of trading days.
- Extremely High: MVRV has been Above 3.2 for approximately 6% of trading days.
By charting periods of MVRV above and below key levels, investors can identify cycle tops and bottoms in the market. For example, cycle lows tend to occur when MVRV is below 0.8, which happens on only around 5% of trading days. Capitulation, a period of intense selling, often starts when MVRV falls below 1.0, which happens on approximately 15% of trading days. Conversely, euphoria, a state of extreme optimism, sets in when MVRV is above 2.4, which occurs on roughly 20% of trading days. Cycle peaks, on the other hand, tend to form when MVRV is above 3.2, which occurs on approximately 6% of trading days.
Pricing bands can then be created based on extreme MVRV ratios, with a ratio of 2.4 corresponding to a pricing band of 2.4x the Realised Price. This tool allows us to estimate price levels that would result in extreme unrealised profit or loss, which in turn may trigger investor behaviour such as profit-taking or capitulation, establishing the cycle top or bottom.
We can also calculate the all-time-average MVRV and using +/- 1 standard deviation bands to spot extremes. This approach provides an even more robust and statistically significant way to identify overbought and oversold conditions for a given cryptocurrency. By looking at the MVRV ratio in this way, traders and investors can better understand the historical valuation of a cryptocurrency and make more informed decisions about when to buy, sell, or hold.
In conclusion, the MVRV Ratio has proven to be an essential tool to gain valuable insights into the Bitcoin market dynamics and investor behaviour patterns. While it's a long-term cyclical oscillator, the current derivatives and methods only scratch the surface of what is possible with MVRV. Thus, understanding this metric is crucial for analysts who want to make informed decisions in the market. Furthermore, understanding MVRV opens up opportunities for creating new iterations, derivatives, and variants, which can enhance its effectiveness even further. As such, we at Ainslie will continue to report on this metric in the future to provide valuable insights to our readers.
According to the present MVRV, the cryptocurrency market is currently experiencing a low phase. If you're interested in purchasing, please contact us to discover how Ainslie can assist you in beginning your cryptocurrency investment journey.