How does gold go after yield curve inverts?
News
|
Posted 22/05/2023
|
11569
The deciphering of financial markets is littered with bad calls made in good faith and full belief. It is, quite simply, a more complex web of interconnected drivers and impacts than most can master. We always maintain that a balanced portfolio of uncorrelated assets is the safest road. We are of course bullion dealers and sell precious metals, each with their own characteristics and market drivers, and each beautifully uncorrelated with most other financial assets. There are however some very reliable financial indicators. One with a near perfect track record is flashing red right now.
On Friday we presented what we consider a MUST read / watch piece on the banking situation in the US and here in Australia. Arguably a core root cause of the banking crisis is the inversion of the yield curve (longer term bond rates lower than short term). Yield curve inversions have a near perfect record too of preceding recessions hence general nervousness and the current near record short positioning for US shares. The chart below shows the GFC of a similar scale:

The following chart from Crescat’s Tavi Costa gives us some insight on how gold performed compared to the world’s biggest share index, the US’s S&P500, in similar periods to where we find ourselves right now.

For context on the ‘by over 70%’ metric check out the following journey through history since we left the gold standard in 1973 and how perversely inverted the curve is right now:

Whilst each precious metal, gold, silver and platinum have different drivers, they all generally get caught up in the commodities complex. Tavi has oft referred to the following chart as the most important macro chart of the decade:

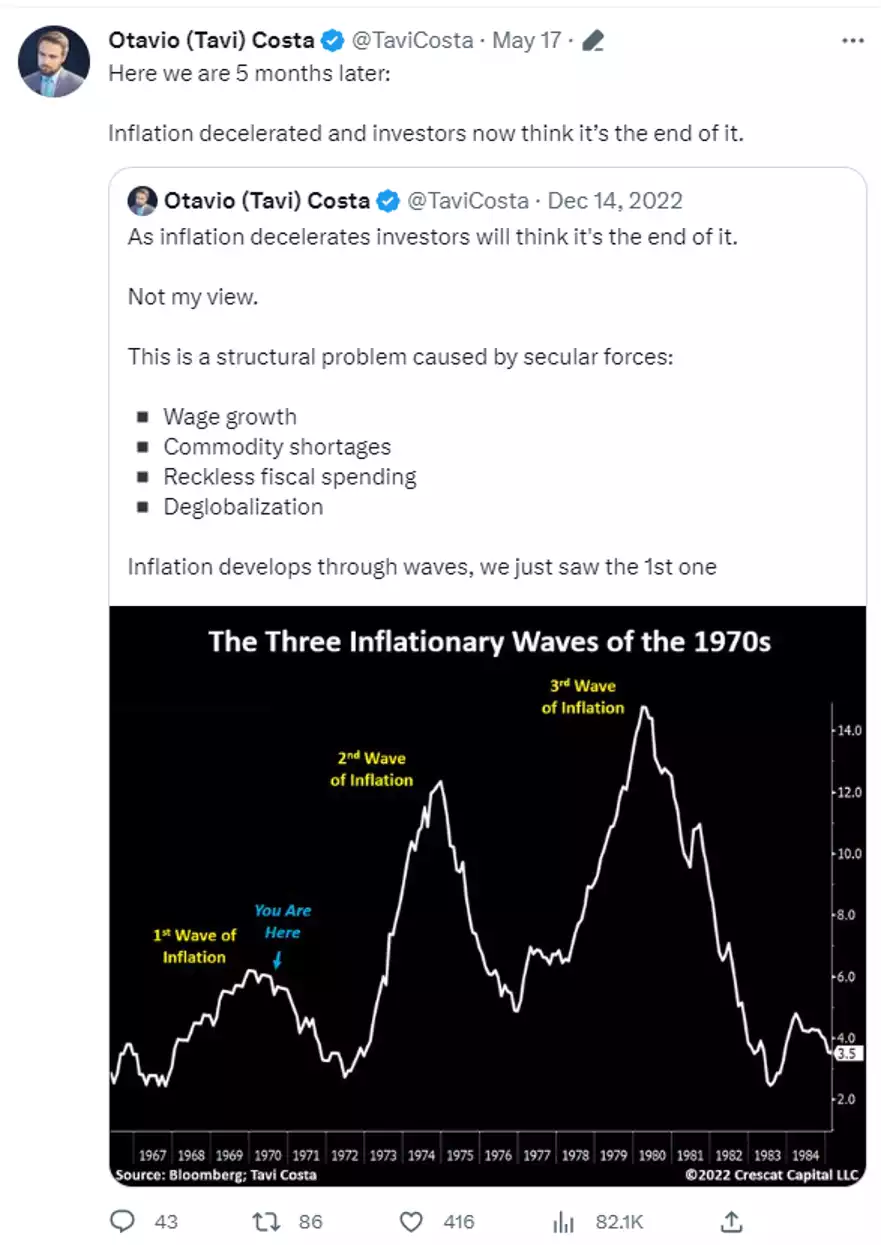
Now you may say that inflation is heading down now and the Fed will somehow orchestrate a soft landing? Others argue they will be forced to pivot earlier than expected, and potentially aggressively, to ‘save us’ from the coming recession, before inflation is dealt with and we will have a repeat of the 70’s as can be seen in the following chart, noting the ‘you are here’ arrow…
We potentially have a new playbook since the GFC where QE is the ‘tool de jour’ and their monetary response is more aggressive than that employed in the 70’s, and the market reaction as well. We wrote to this change in Its All About Liquidity which is also a must read. And so we may not see the same high street inflation this time but instead real asset inflation of which gold has an incredible correlation to as well.