How Unsustainable is U.S. Government Debt – Penn Wharton Budget Model
News
|
Posted 24/10/2023
|
3825
The IMF has recently come out to claim US deficits are unsustainable labelling the US debt ‘the most worrying’ among countries globally… and when the World Reserve Currency is the most worrying in the world – people start paying attention… Many commentators have recently started to sound alarm bells in regard to US debt – and today we will do the same and look into some of the modelling that is used to look at the sustainability and how even these are floored.

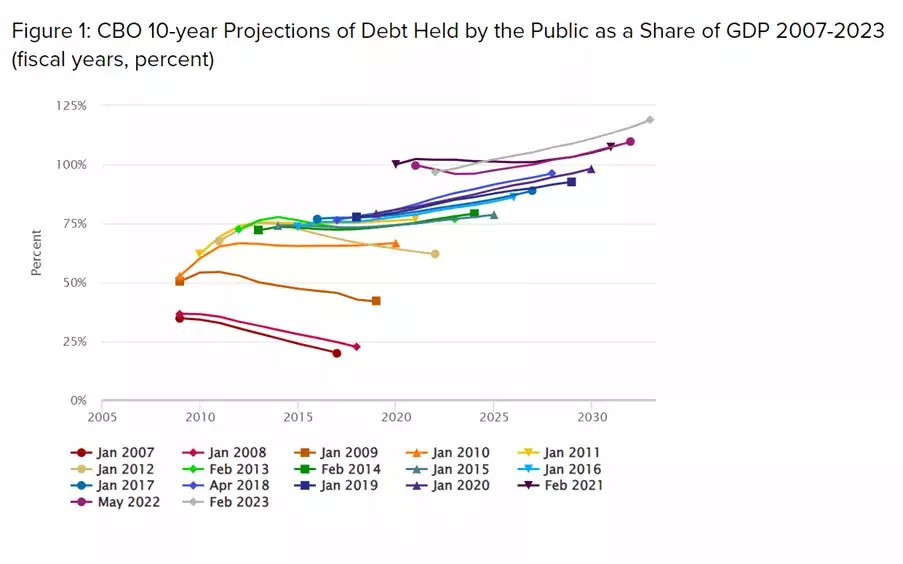
Penn Wharton Budget Model
The Penn Wharton Budget Model is used by governments and credit ratings to determine the forward looking deficits and their impact on government debt models. You often hear 2050 as the drop dead date where the US debt held by the public reaches 200% which has been identified as the ‘unsustainable level’. Today we look at why that number is filled with optimism especially under the current US political landscape and why the end will come sooner without immediate action from the US Congress to tame in their out of control fiscal spending. Interestingly for the last month adding on average of $20 billion a day or $600 billion. We posted a great looking into this yesterday too.
Penn Wharton Budget Model – Assumptions and Conclusions
What is it and what are some of the assumptions that they have made to estimate 2050 as the drop dead US budget default date? In a recent special issue from Penn Wharton When Does Federal Debt Reach Unsustainable Levels? — Penn Wharton Budget Model (upenn.edu) they concluded the following:
Summary: PWBM estimates that---even under myopic expectations---financial markets cannot sustain more than the next 20 years of accumulated deficits projected under current U.S. fiscal policy. Forward-looking financial markets are, therefore, effectively betting that future fiscal policy will provide substantial corrective measures ahead of time. If financial markets started to believe otherwise, debt dynamics would “unravel” and become unsustainable much sooner.
The paper also identified the increased tax burden from wars and an aging population that have not been accounted for in the modelling stating:
‘The US is neither at war nor in a recession. Nonetheless, it is running a budget deficit of 7 per cent of GDP with deficits projected to reach 10 per cent of GDP by 2030 and to increase from there as Medicare and social security programs put a greater burden on the nation’s finances. If more spending on defence and decarbonisation is needed, then the outlook will grow even more grim. US government debt is now around US$33 trillion.’
These assumptions therefore assume the following which are arguably assumptions that shouldn’t have been made:
- There will be years of budget surpluses (something that has not been achieved since 2001, and even that relied on some clever accounting…) and it also assumes that
- There will be no ‘risk premium’ applied to US debt (something that we are starting to see occur quickly now with the reinverting of the yield curve)
What’s $600 billion a month?
Just extrapolating out the current US spend of $600 billion per month with US tax receipts optimistically staying at current rates of approximately $4.5 trillion per annum. With $600 billion per month, the US deficit which is currently claimed at $2 trillion per annum is underdone by close to $700 billion, and this is without taking into account new debt and reissued debt being couponed at 5%. The deficit is likely closer to $1 trillion more than estimates. So if the Penn Wharton model is taking the government at their fiscal word – they are once again underestimating the 10 year modelling, which hasn’t gotten it right since its inception in 2007
So, with current US GDP at $23.3 trillion and current publicly held debt at $26.3 trillion, an additional $1 trillion per annum sees us reach the debt default level much sooner. On basic numbers the estimated equivalent would be 138% verse 166% of GDP by 2030.
|
|
GDP @ 4%
|
$2 trillion@ 4%
|
$3 trillion@ 4%
|
$2 trillion deficit %GDP
|
$3 trillion deficit %GDP
|
|
2023
|
22.30
|
26.3
|
27.3
|
118%
|
122%
|
|
2024
|
23.19
|
28.34
|
30.34
|
122%
|
131%
|
|
2025
|
24.12
|
30.38
|
33.38
|
126%
|
138%
|
|
2026
|
25.08
|
32.42
|
36.42
|
129%
|
145%
|
|
2027
|
26.09
|
34.46
|
39.46
|
132%
|
151%
|
|
2028
|
27.13
|
36.5
|
42.5
|
135%
|
157%
|
|
2029
|
28.22
|
38.54
|
45.54
|
137%
|
161%
|
|
2030
|
29.35
|
40.58
|
48.58
|
138%
|
166%
|
*$2 vs $3 trillion US deficit debt as % of GDP
Interestingly if we throw the $6.8 trillion Quantitative Tightening into the equation, with $6.8 trillion that is currently held by the Federal Reserve and assuming a $1 trillion run off per year with a $3 trillion deficit – the deficit would hit close to 189% by 2030…
|
|
GDP@4%
|
$2 trillion @4%
|
$3 trillion @4%
|
$2 trillion deficit %GDP
|
$3 trillion deficit %GDP
|
|
2023
|
22.30
|
26.3
|
27.3
|
118%
|
122%
|
|
2024
|
23.19
|
29.34
|
31.34
|
127%
|
135%
|
|
2025
|
24.12
|
32.38
|
35.38
|
134%
|
147%
|
|
2026
|
25.08
|
35.42
|
39.42
|
141%
|
157%
|
|
2027
|
26.09
|
38.46
|
43.46
|
147%
|
167%
|
|
2028
|
27.13
|
41.5
|
47.5
|
153%
|
175%
|
|
2029
|
28.22
|
45.34
|
51.54
|
161%
|
183%
|
|
2030
|
29.35
|
48.38
|
55.38
|
165%
|
189%
|
Falling Tax Revenue
We recently discussed the US jobs report with government jobs outpacing public jobs by 2 to 1, remembering the tax revenue from the public jobs supports the government jobs via US government spending, so at a tax rate of 25% private jobs need to outpace public jobs by a minimum 4 to 1 to justify these public jobs. Anything less will ultimately lead to an outpacing of national debt to GDP.
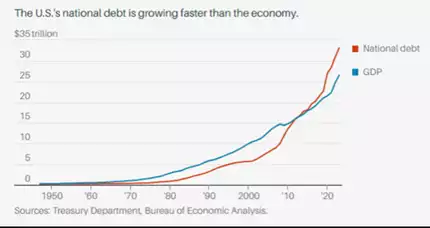
With national debt growing faster than GDP since 2010, and more recently increasing at a faster rate, the US is also facing a shrinking tax revenue base, with a rolling average 8.4% fall.
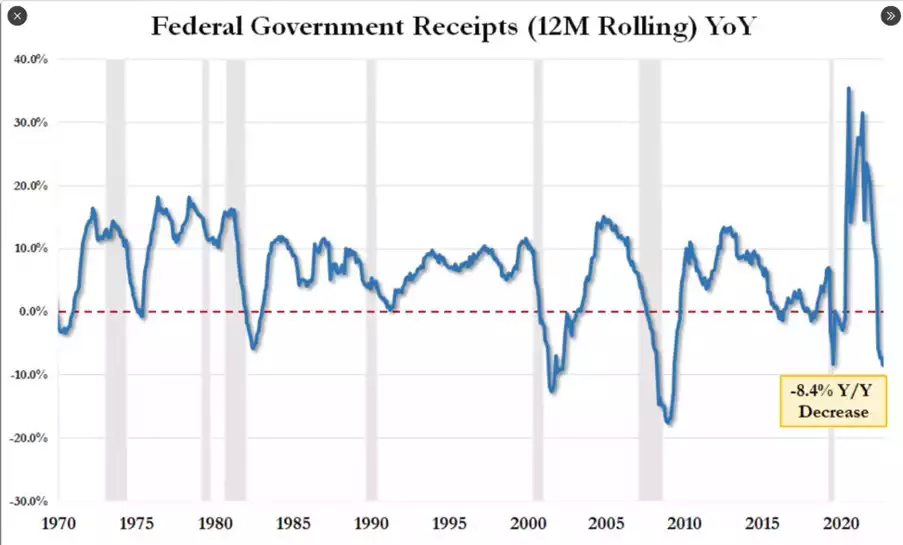
Assuming the tax revenue continues to fall without moderating deficits – the default level could even occur in this decade!
|
|
GDP @ 4%
|
Revenue fall 8%
|
Expenditure @4%
|
Deficits @ 2 trillion
|
Reduced tax revenue $2 trillion %GDP debt
|
Reduced tax revenue $3 trillion %GDP debt
|
|
2023
|
22.30
|
4.50
|
6.50
|
2.00
|
118%
|
131%
|
|
2024
|
23.19
|
4.14
|
6.76
|
2.62
|
125%
|
140%
|
|
2025
|
24.12
|
3.81
|
7.03
|
3.22
|
133%
|
151%
|
|
2026
|
25.08
|
3.50
|
7.31
|
3.81
|
143%
|
162%
|
|
2027
|
26.09
|
3.22
|
7.60
|
4.38
|
155%
|
175%
|
|
2028
|
27.13
|
2.97
|
7.91
|
4.94
|
167%
|
189%
|
|
2029
|
28.22
|
2.73
|
8.22
|
5.50
|
180%
|
203%
|
|
2030
|
29.35
|
2.51
|
8.55
|
6.04
|
194%
|
218%
|
- Reduced tax revenue and impact on % GDP to debt
Yield Curve Reinverting
The alarm bells are ringing, the yield curve is reinverting and quickly with the holders and buyers of US debt clearly not believing the 2050 year that is currently being sold to the world. 1 month rates have increased 2% and all other bond periods have either breached 5% or will do so in the next couple of weeks.
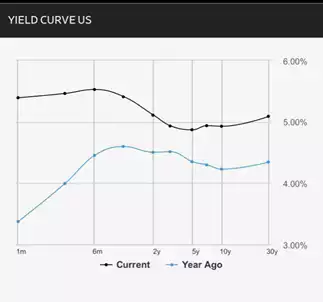
*yield curve rates current vs 12 months ago
The end will come sooner and all depends on the US becoming more prudent, more responsible and non- divisive which with the current inability to even elect a Speaker seems unlikely in the short term. The yield curve has recently started reinverting – a warning we gave previously – as US government risk is priced in. So, watch this space carefully as we will warn you again the risk has been priced in for 2050 and, with models using unrealistic assumptions and governments continue their fiscal party, 200% is likely to be reached a lot earlier and therefore the risk premium is simply not enough. There is a very good reason bonds are selling off and gold is surging…