How Far is the Great Depression 2.0?
News
|
Posted 24/09/2025
|
2708
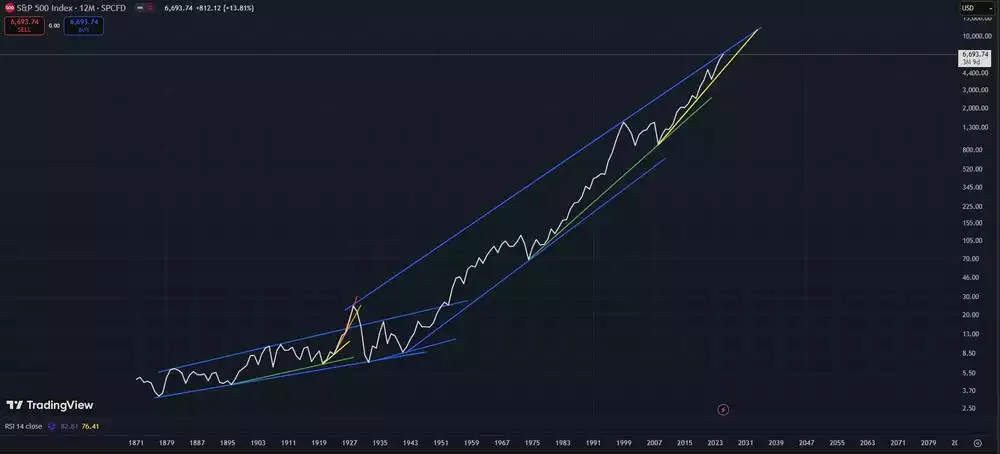
The final vertical stages of parabolic price action typically resolve violently to the downside.

The chart above illustrates the S&P 500 from 1871 to 2025.
Today, we find ourselves once again testing the long-term resistance line that stretches from the Roaring Twenties to the Dotcom boom. While this level will likely provide significant resistance, calling a definitive macro top at this point would be a bold move—especially when considering broader global liquidity conditions, the business cycle, the land cycle, and the bond market. That said, it's not out of the question.
Although we don't yet have a clear signal of a macro top, warning signs are mounting. A major market event within this decade appears increasingly likely, with the US bond market a probable catalyst.
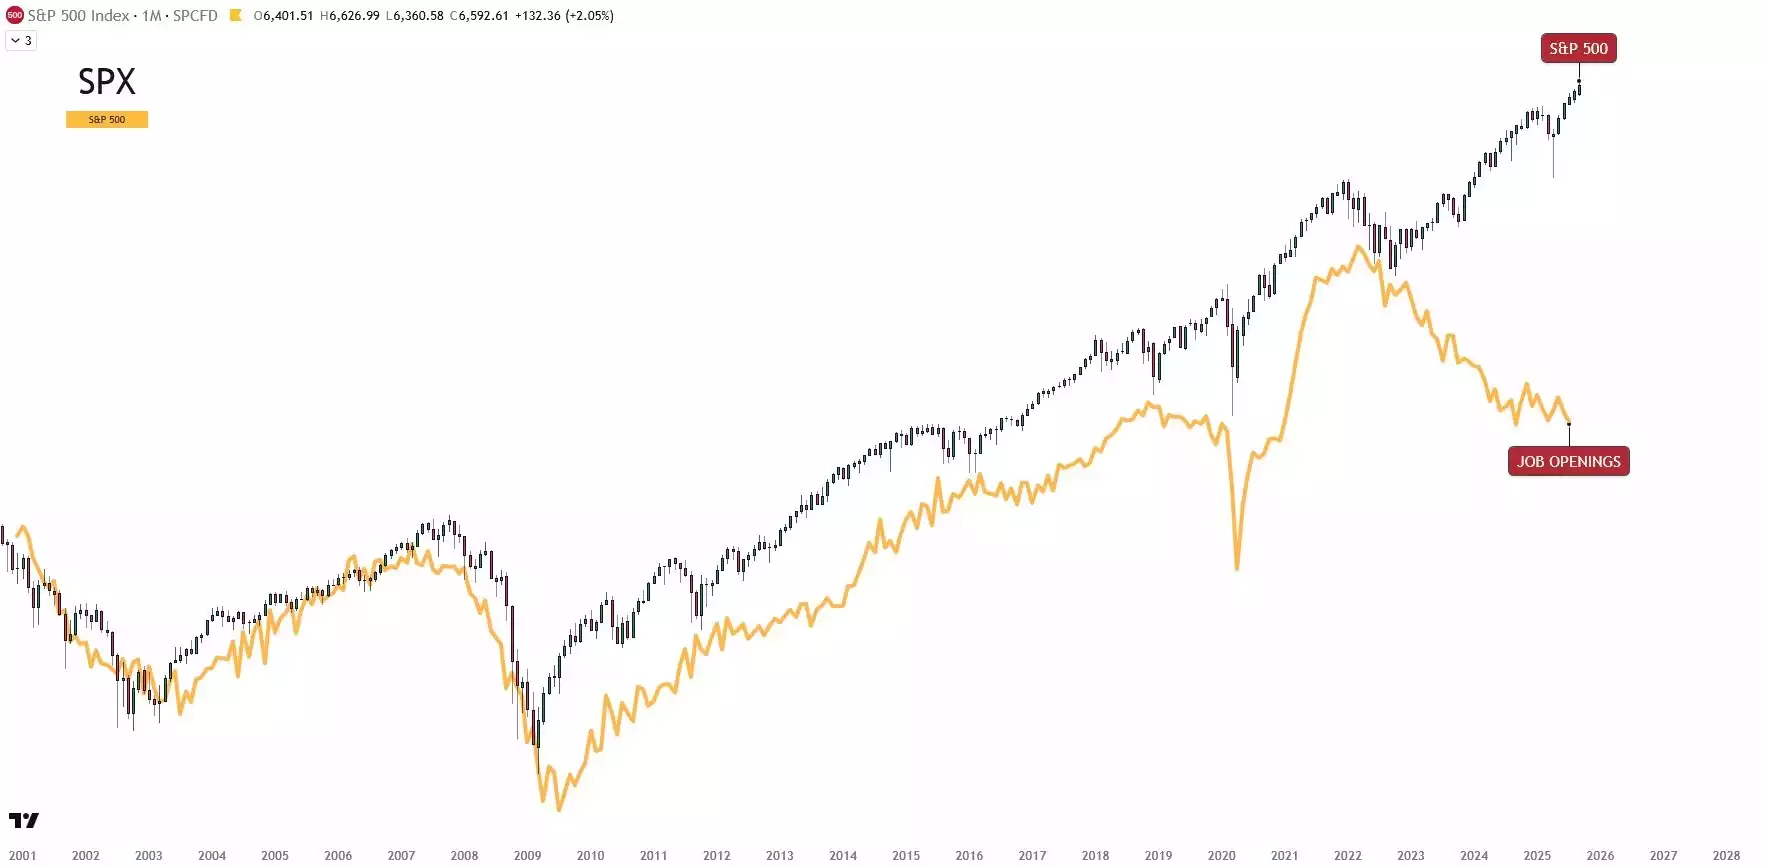
At the same time, the US economy continues to weaken. A growing divergence between employment figures and the S&P 500 is setting up for eventual resolution. Without a sharp and unlikely rise in job openings—particularly with the AI revolution still in its early stages—the likely outcome is a correction in equity markets. While such divergences can persist for years, they don't last forever.

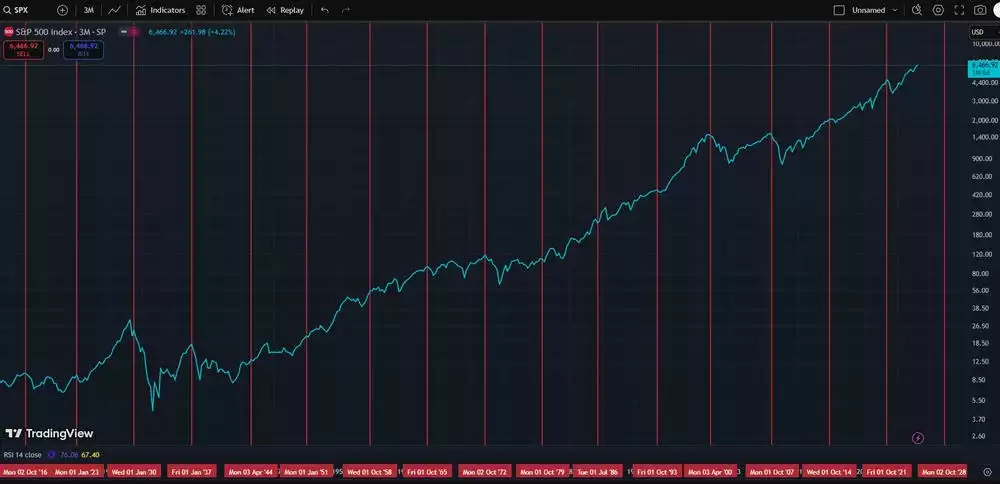
We are also approaching the peak of several major cycles. The 18.6-year land cycle is expected to top out between 2024 and 2028—the last peak coincided with the Global Financial Crisis. The 80-year socioeconomic cycle is forecast to peak by 2030, with the previous instance being the Great Depression. Additionally, the 7-year Shmita cycle, due again in 2028, has historically aligned with major market events including the Dotcom crash, the GFC, and the Depression.
In short, the next few years are poised to be pivotal for global financial markets.

The recent downgrade of US sovereign debt from AAA to AA+, combined with record government debt now at US$37.27 trillion, puts further pressure on the US bond market. A shock here could well serve as the trigger for the confluence of land and socioeconomic cycle peaks—both historically marked by systemic financial upheaval. The socioeconomic cycle, in particular, tends to be accompanied by a collapse in the prevailing financial power structure, clearing the way for a new system to take shape over the next 80 years.
Given that US bonds underpin the global financial system and are looking increasingly fragile, it's no surprise that central banks have been accumulating gold at five times their usual rate since 2022.
Two key indicators that would signal the peaks are near include:
- A divergence between land and stock markets (with land peaking ahead); and
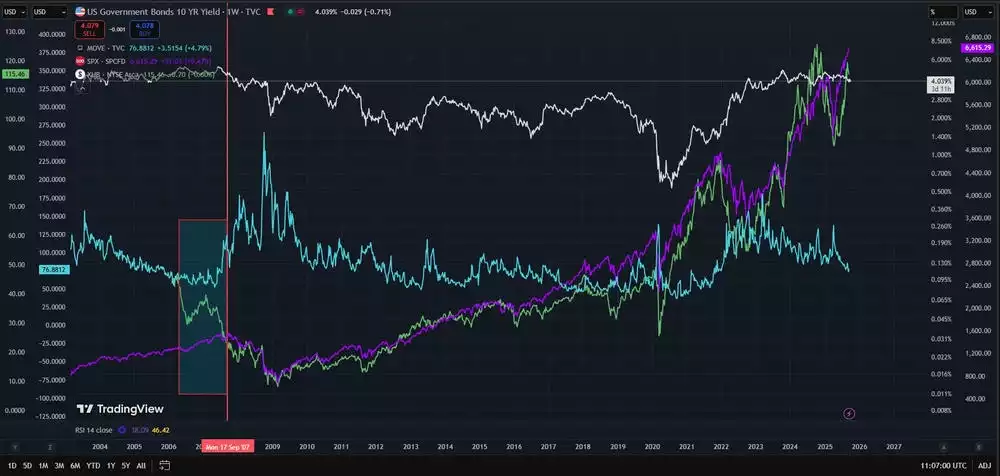
- A spike in volatility across US bond markets, measured by the MOVE Index.
As shown below, prior to the last land cycle peak, we saw a multi-month divergence between land and equities—followed by a surge in the MOVE Index.
While a similar divergence may be forming today, it has yet to be confirmed. Meanwhile, US bond market volatility continues to trend lower.

Watch the Insights video inpired by this article here: https://www.youtube.com/watch?v=S72VX7BOi8A