Housing biggest driver of inflation – are interest rates the fuel?
News
|
Posted 20/06/2023
|
10133
An interesting article came out recently from the Chicago Federal Reserve. In summary they reviewed the inflation differentials across sections of the US and concluded ‘We find that price changes in the housing sector are the main driver of regional differences in inflation in the two time periods we investigate: January 2002–January 2023 and January 2019–January 2023’.
We talk further about what this means for interest rate rises in inelastic supply countries like Australia and what immigration and interest rate rises may be doing to increase these differentials and shift and increase, rather than reduce, inflation.
Immigration drives lower inflation – Fact or Fiction?
It is a commonly held position of economists that high net immigration drives down wages and increases unemployment tempering inflation. This theory has held well until recently, but governments and central banks are not appearing to grasp this. Covid supply shortages led to long lead times and higher costs to produce goods. Housing, with a long lead time, is still in the middle of this ‘shock’ with reduced and more expensive houses available. This can be currently seen in Australia. With high immigration and demand this has created supply inelasticity. The more expensive it becomes with interest rate rises due to low and expensive stock, people are forced into a position of just paying the higher price.
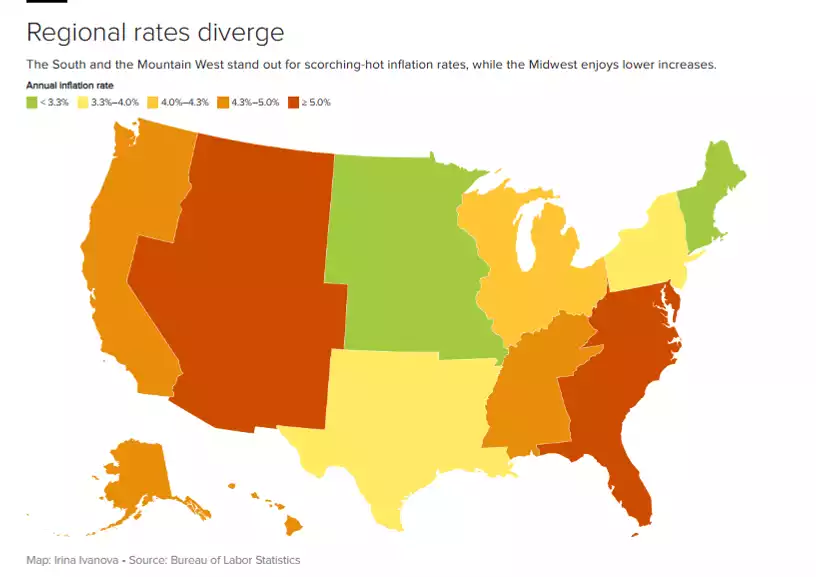
A recent research paper by the Chicago Federal Reserve has illustrated this supply inelasticity, shown in the disparity within the US states with high and low immigration. The higher immigration states have been seeing sustained inflation driven by housing costs, whereas the lower immigration states are generally seeing lower inflation.
Federal Reserve Bank of Chicago ‘What is Driving the Differences in Inflation Across US Regions?
A May 2023 paper by the Federal Reserve Bank of Chicago, What Is Driving the Differences in Inflation Across U.S. Regions? - Federal Reserve Bank of Chicago (chicagofed.org) focuses on the regional differences in inflation and concluded it was in fact the price changes of shelter, including rent and owners equivalent rent, that were the major contributing variable in inflation differentials across US regions. Looking at current inflation across regions, several regions are currently sitting safely or under the US Federal Reserves target inflation of 2%. The findings by the Chicago Paper illustrate that interest rate rises increasing house repayments, may actually be increasing inflation.


Immigration, Inflation, Interest rates and Inelastic supply
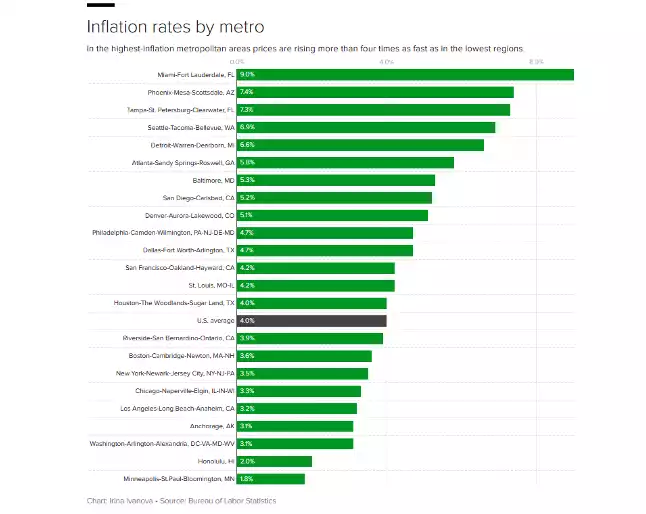
If housing is indeed the larger contributor to the inflation differential as the Chicago Fed concluded, higher immigration will be adding fuel to the fire. In fact, Miami, with the highest inflation at 9%, is part of the state running one the highest net immigration levels in the US, with net immigration of 665,000 people or 29.9 per 1000.
So now consider interest rate rises and their effects in the US – due to 30 year fixed mortgages, interest rate rises in the US will push up new housing more than existing, as people will choose to stay put with low fixed rate mortgages. So, in high immigration areas like Florida new houses need to be built to accommodate all the immigrants, with new housing supply and price higher due to covid, this makes prices quite inelastic. The supply inelasticity of housing therefore adds substantially to housing inflation and therefore interest rate rises increase inflation in these states. Inflation in Florida currently sits around 7-9% depending on the city.
Now consider the alternative – Minnesota has a net immigration of -6.5%, losing 37,377 people in 2023. With rising interest rates and a smaller need for housing people are selling their houses in a rising interest environment. As they sell people buy with higher interest rates driving the price of houses even lower, as the population is shrinking. This means house prices and housing inflation will be much lower than where there is supply inelasticity. Minnesota has a current inflation rate of 3.7% and Minneapolis only 1.8%.
What this therefore means is each time the Federal Reserve raises interest rates due to the immigration differentials it is pushing high immigration state’s housing costs higher creating inflation and on the other side, states with low immigration are seeing housing costs decrease and lower inflation.
|
Rank
|
State
|
Net Immigration
|
Per 1000
|
House price change rank 1 year
|
House price change rank 5 year
|
|
1
|
Florida
|
622,476
|
28.9
|
8
|
2
|
|
2
|
Texas
|
475,252
|
16.31
|
28
|
24
|
|
3
|
North Carolina
|
211,867
|
20.29
|
2
|
6
|
|
4
|
Arizona
|
182,362
|
25.5
|
43
|
4
|
|
5
|
South Carolina
|
165,948
|
32.42
|
1
|
9
|
|
6
|
Tennessee
|
146,403
|
21.18
|
15
|
3
|
|
7
|
Georgia
|
128,089
|
11.96
|
18
|
10
|
|
8
|
Idaho
|
88,647
|
48.2
|
46
|
1
|
|
9
|
Alabama
|
65,355
|
13.01
|
12
|
14
|
|
10
|
Oklahoma
|
56,807
|
14.35
|
23
|
29
|
|
11
|
Nevada
|
56,317
|
18.14
|
50
|
21
|
|
12
|
Utah
|
47,125
|
14.4
|
51
|
8
|
|
13
|
Montana
|
39,041
|
36.01
|
33
|
7
|
|
14
|
Arkansas
|
38,055
|
12.64
|
5
|
19
|
|
15
|
Maine
|
30,642
|
22.49
|
3
|
5
|
|
16
|
Delaware
|
27,119
|
27.39
|
27
|
41
|
|
17
|
Indiana
|
22,694
|
3.34
|
25
|
16
|
|
18
|
Missouri
|
20,233
|
3.29
|
22
|
23
|
|
19
|
Colorado
|
17,984
|
3.11
|
44
|
30
|
|
20
|
New Hampshire
|
16,038
|
11.64
|
29
|
11
|
|
21
|
South Dakota
|
14,711
|
16.59
|
6
|
15
|
|
22
|
Kentucky
|
14,102
|
3.13
|
10
|
26
|
|
23
|
Vermont
|
5,893
|
9.16
|
4
|
12
|
|
24
|
Wyoming
|
4,356
|
7.55
|
17
|
32
|
|
25
|
West Virginia
|
2,460
|
1.37
|
39
|
45
|
|
26
|
Connecticut
|
−76
|
−0.02
|
7
|
34
|
|
27
|
Oregon
|
−776
|
−0.18
|
45
|
39
|
|
28
|
New Mexico
|
−5,058
|
−2.39
|
14
|
18
|
|
29
|
Rhode Island
|
−5,281
|
−4.81
|
11
|
13
|
|
30
|
Iowa
|
−6,877
|
−2.16
|
13
|
44
|
|
31
|
North Dakota
|
−7,186
|
−9.22
|
34
|
49
|
|
32
|
Washington
|
−7,376
|
−0.96
|
48
|
17
|
|
33
|
Nebraska
|
−11,108
|
−5.66
|
24
|
31
|
|
34
|
Wisconsin
|
−11,383
|
−1.93
|
9
|
20
|
|
35
|
Mississippi
|
−11,408
|
−3.85
|
20
|
40
|
|
36
|
Alaska
|
−11,412
|
−15.56
|
21
|
48
|
|
37
|
Kansas
|
−14,392
|
−4.90
|
30
|
35
|
|
38
|
Pennsylvania
|
−16,218
|
−1.25
|
31
|
37
|
|
39
|
Hawaii
|
−29,684
|
−20.40
|
32
|
27
|
|
40
|
Virginia
|
−29,775
|
−3.45
|
19
|
33
|
|
41
|
Minnesota
|
−37,377
|
−6.55
|
40
|
43
|
|
42
|
Ohio
|
−39,915
|
−3.38
|
26
|
22
|
|
43
|
Michigan
|
−43,188
|
−4.29
|
37
|
25
|
|
44
|
Maryland
|
−68,287
|
−11.05
|
41
|
47
|
|
45
|
Louisiana
|
−80,278
|
−17.24
|
42
|
50
|
|
46
|
New Jersey
|
−107,749
|
−11.60
|
16
|
28
|
|
47
|
Massachusetts
|
−110,866
|
−15.77
|
38
|
36
|
|
48
|
Illinois
|
−282,048
|
−22.01
|
35
|
46
|
|
49
|
New York
|
−664,921
|
−32.91
|
36
|
38
|
|
50
|
California
|
−871,127
|
−22.03
|
49
|
42
|
|
—
|
District of Columbia
|
−26,210
|
−38.01
|
47
|
51
|
So where has the theory gone so wrong?
The theory appears to have gone wrong in that immigration certainly helps contain inflation, but trying to fix a ‘demand shock’ like covid with a ‘supply shock’ like mass net immigration has only exacerbated the problem. During covid it was made near impossible to get materials without paying exorbitant prices multiplied with exorbitant shipping, multiplied by labour shortages. Now those materials that are finally seeing inflation moderating as discussed in last weeks China – the Canary in the Global Economy (ainsliebullion.com.au), are being used to build housing that have lead times of 12-18 months or more and the covid priced houses are only just being delivered. So rather than allowing the demand shock to move through the economy and the finishing of the supply of long lead time goods such as housing, some governments have tried to use the immigration trick to drive down wages and inflation, but it has backfired. With housing shortages after covid and high immigration with no housing supply, the governments have created supply inelasticity. Each time the RBA lifts interest rates they are actually adding to inflation as they add to housing costs, with housing costs one of the largest contributors to inflation in the western world.
The solution? Not an easy one as we need labourers to build, and unemployment is at an all-time low. But at least a suggestion – when the world changes modelling and policies need to change as what worked in the GFC is not working now. Constant demand and supply shocks are creating huge economic differentials like what we’ve seen in the US states and Australia and China. Sometimes a wave needs to go through an economy before another opposing wave gets let off – this just creates choppy waters and a lot longer to settle.
Just remember when the waters are choppy, Gold is an option to offer a safe harbour😊
---------------------------------------------------------------------------------------------------------------------------------------------
Join us for Ainslie Live
How To Get FREE Silver - Ainslie LIVE!
How to get free silver is today's livestream topic, plus we have the usual Show & Tell and Q&A session. Join us every Tuesday @ 10:30am AEST on any of the socials listed. Bring your questions, your winning attitudes... and a tasty beverage. See you there!
Click here to watch