Historic Moves in Physical Gold Markets
News
|
Posted 27/02/2025
|
2017
The recent unprecedented moves in physical gold settlements and spike in gold lending rates have many speculating on what could be causing these historic moves, and what the gold market might know about an upcoming financial event.
A quick recap on what we have witnessed, leaving many baffled.
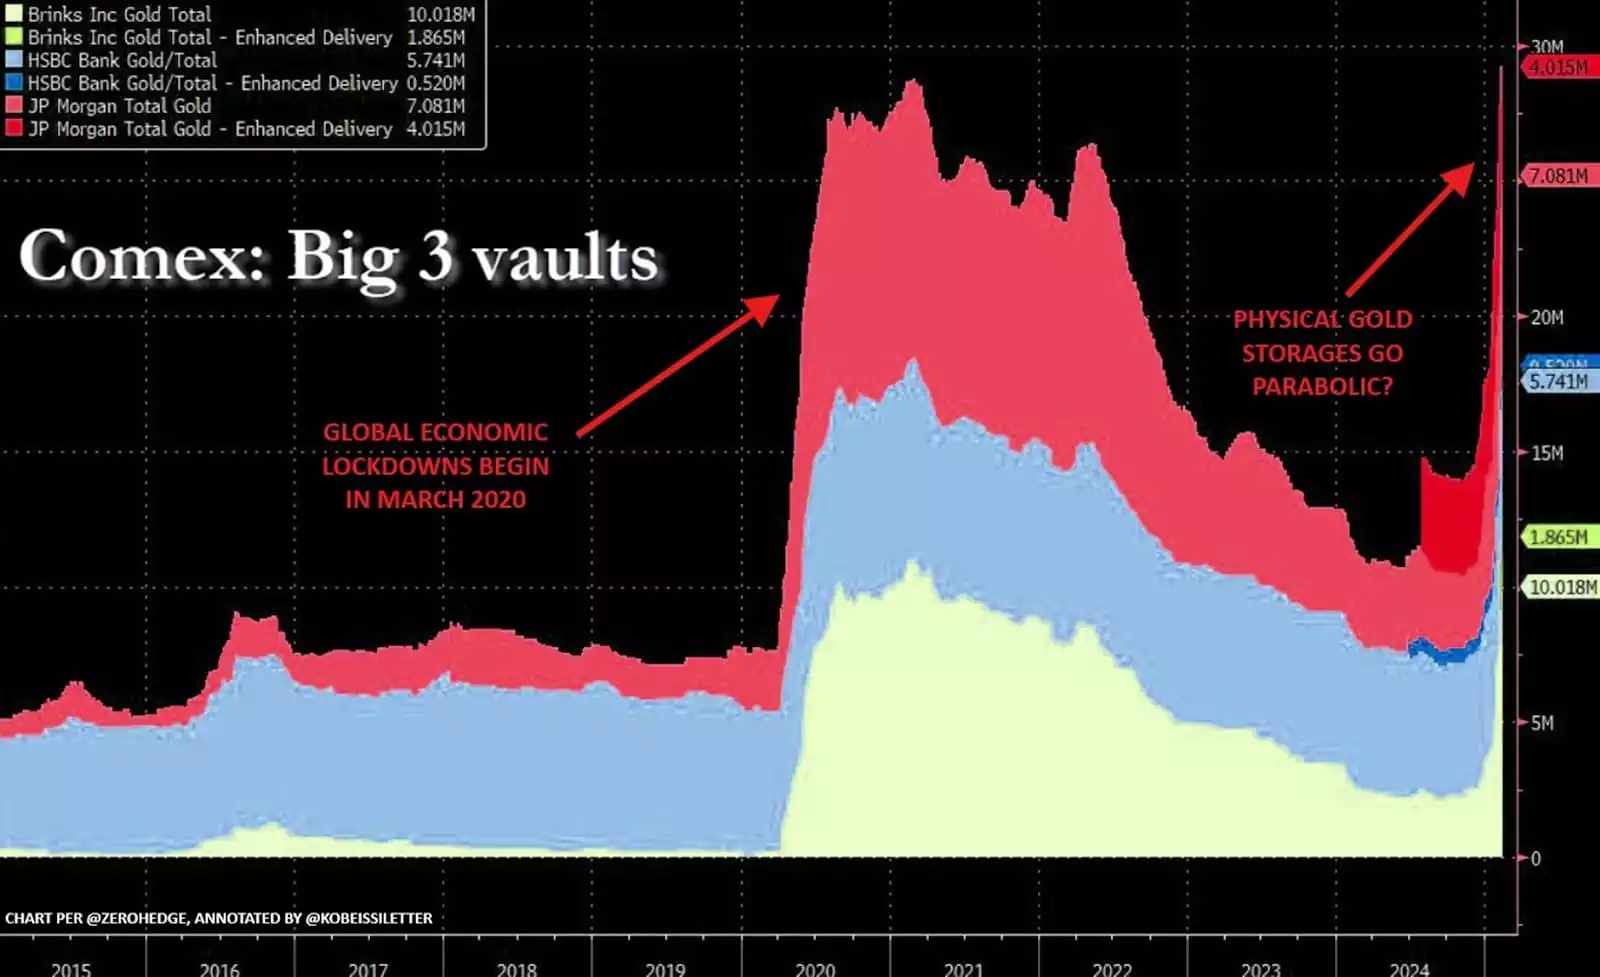
500 tons of gold have been delivered to COMEX vaults in the past two months. JP Morgan is set to deliver US$4,000,000,000 in physical gold (one of the largest shipments in history). With a total of 59,296 contracts standing for delivery, breaking the June 2020 record with many speculating on who the buyers are - the U.S. Treasury, or the Federal Reserve?

There is a widespread discourse about a range of possibilities behind these moves in physical gold, some of which are a potential Fort Knox audit, financial giants positioning for Basel III endgame in July (or front-running Basel IV requirements), the US$9T of refinancing coming this year for the U.S. government debt, hedging for Trump tariffs, or arbitrage trading with Shanghai Gold Exchange physical settlement program.
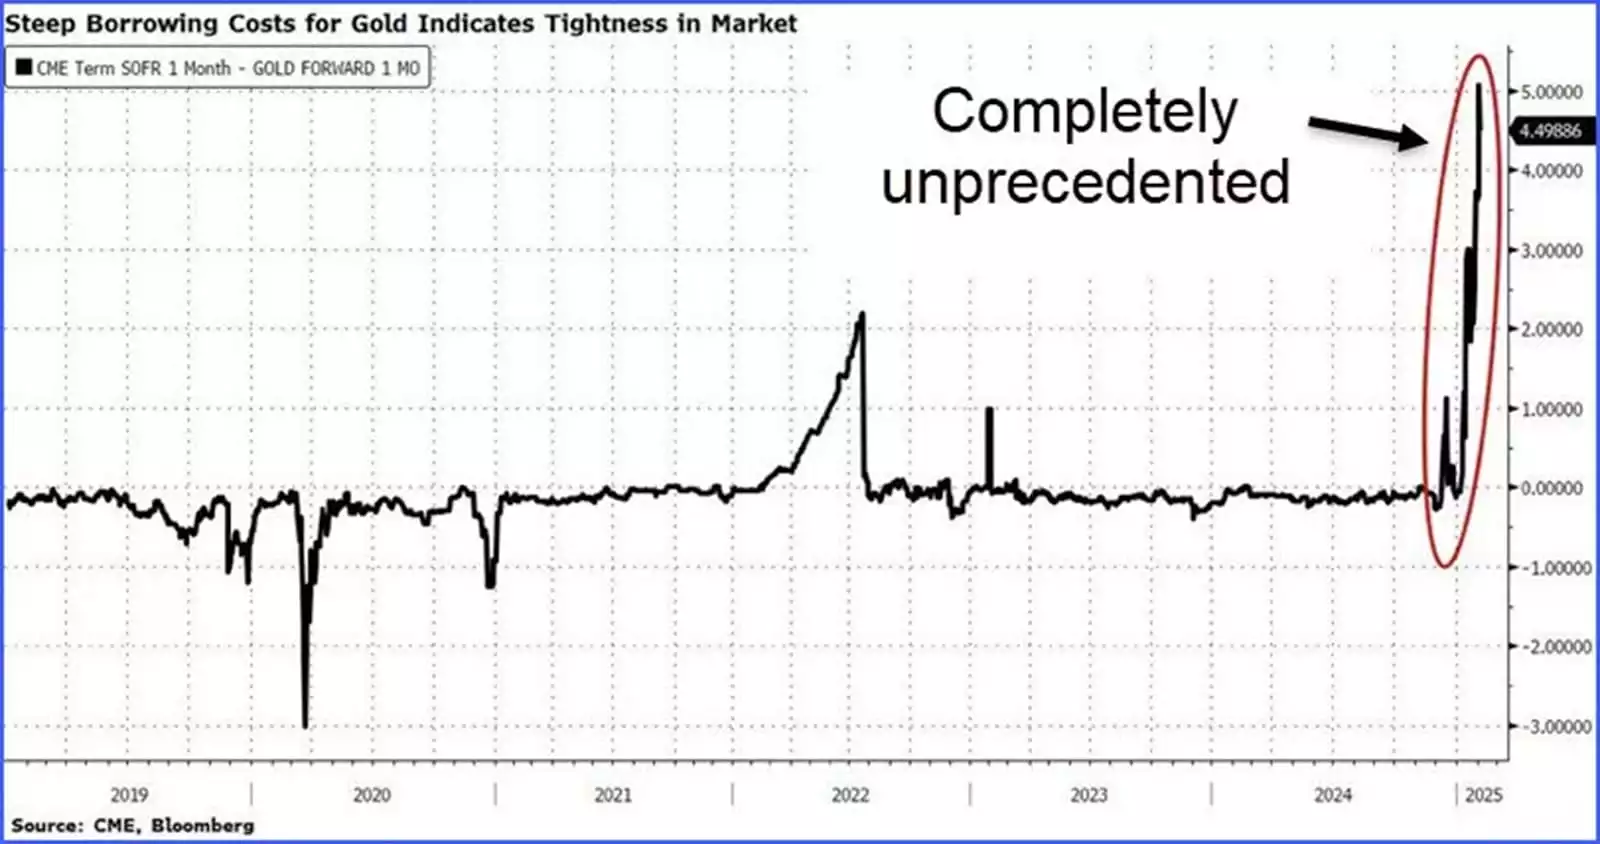
Meanwhile, the strain on paper gold markets has many concerned about the long-running “fractional reserve gold lending” system breaking down under pressure for physical settlements amid a rapid rise in spot prices. Occasionally this market gets off balance when there’s a rush for physical gold and the way this imbalance presents itself is in the “gold lease rate”.
If there is a need for physical gold, but whoever needs it, doesn’t want to buy it outright, for whatever reason - they can lease it. When we see a rise in the lease rates, we know that the physical gold supply is tight and getting harder to find. With the recent moves in physical gold, the gold lease rate spiked to unprecedented levels, signifying a scrambling between big players for physical gold. This is a historic move in the gold markets.

Minor spikes can indicate an unwinding of trades where big players were incorrectly positioned in the market, but not at this speed and to this degree. The current spike suggests there could be a much bigger problem brewing. With the paper gold to physical gold ratio at about 130:1 - a temporary breakdown of this system would result in an epic scramble for physical gold, and a significant revaluation of gold prices.
These are early warning signs for what is expected from both the 18.6-year land cycle and 80-year socio-economic cycle due to converge this decade. That is, a financial crash at a centennial scale. The gold market always knows ahead of time.
While various technical and economic indicators have already validated this expectation, the gold market is firing off some serious warnings that strongly back these indicators up.

Stoch RSI resetting from overbought to oversold, on the yearly S&P500 chart (blue) is a technical indicator flashing red. We see gold (orange) outperforming in these phases.

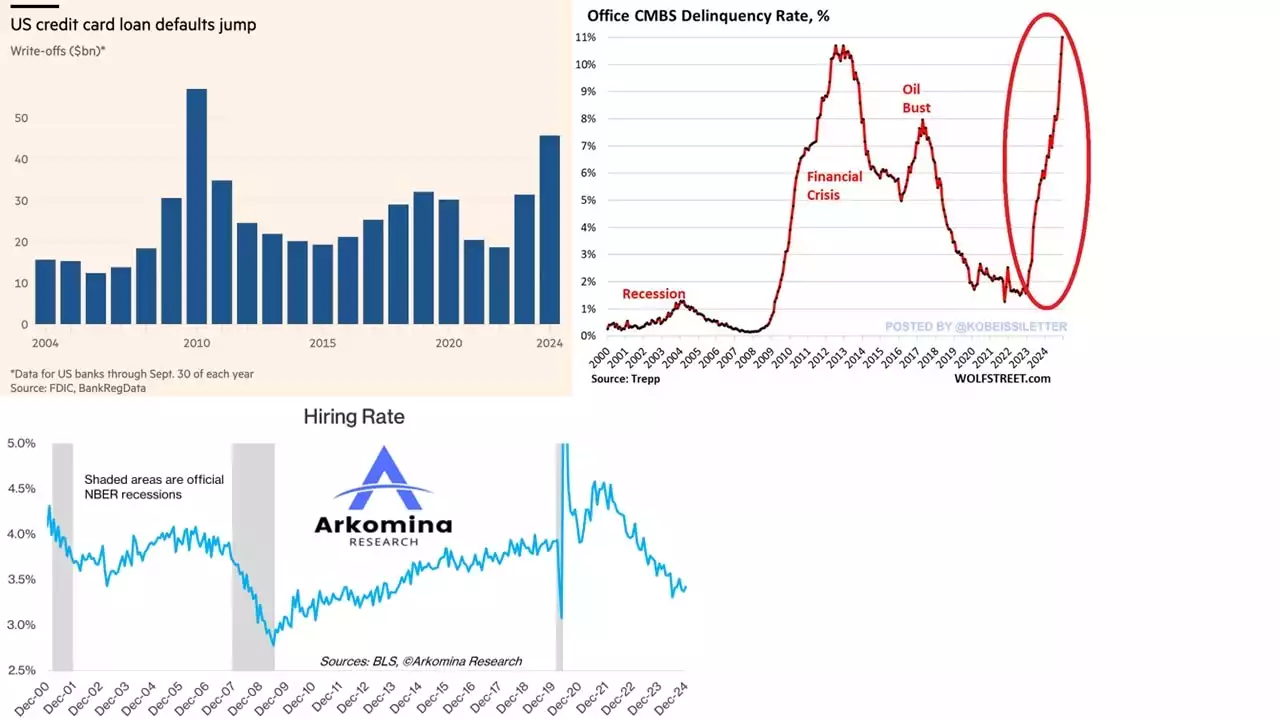
Corporate Mortgage-Backed Securities delinquency rate at an all-time high, credit card defaults spiking to nearly 2008 levels, and the hiring rate downtrend - are some of the many economic indicators flashing red.
Finally, looking at silver we see that lease rates have spiked to 8%. India imported 2,600 tons of silver from the UAE, a significant portion of global output – and the silver futures markets have entered backwardation with a negative carry cost for future delivery - showing a scramble for physical silver to be delivered today. It appears that industrial demand, particularly from Asia, is driving this trend. All signs are pointing to the likelihood of silver becoming unobtainable as an investment asset once gold is exhausted.
The backwardation in silver suggests a potential squeeze, where demand outstrips available supply, leading to price volatility. With the Gold to Silver Ratio currently sitting over 90, and a macro technical “cup and handle” bullish pattern playing out on the silver chart, we have an exciting macro setup for silver quietly building while gold is stealing the spotlight.
As the scramble for physical gold and silver intensifies, the upcoming decade is shaping up to live up to the expectation of being a historic one for the precious metals markets as the macro trends are only just getting started.