Gold’s 8-Year Cycles - We Haven’t Seen Anything Yet!
News
|
Posted 04/06/2025
|
4193
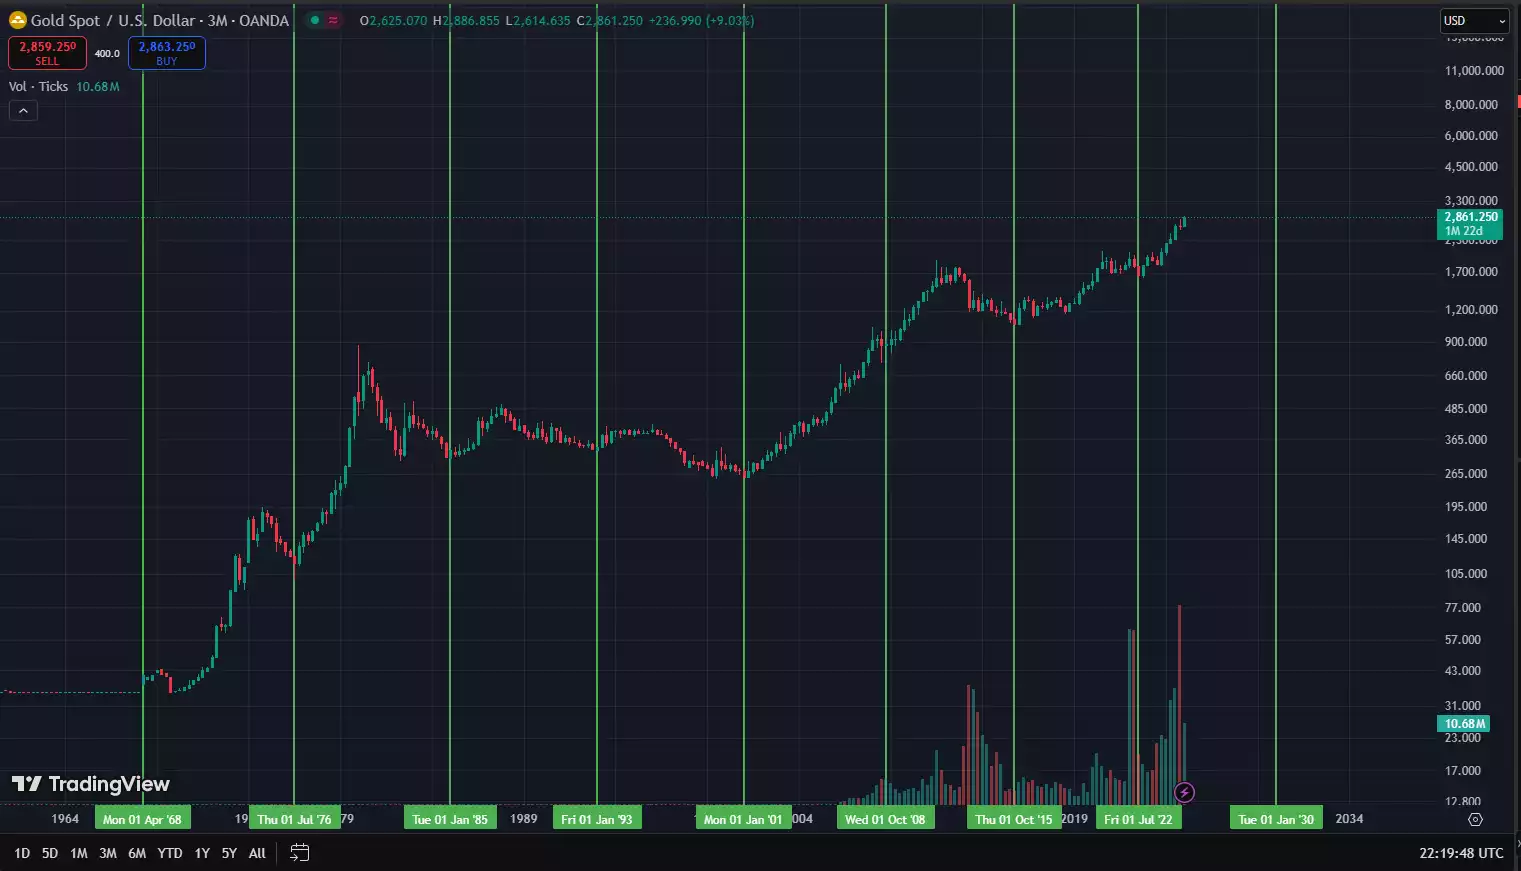
Since the US abandoned the gold standard and the Bretton Woods system was abolished, gold, priced in US dollars, has been exhibiting consistent 8-year cycles, as measured from low to low.

The most recent 8-year cycle low was in late 2022, with the next one expected sometime in 2030, placing the “half cycle low” in late 2026.
A strong bullish cycle is generally “right translated”, where the peak forms to the right of the midpoint. A combination of the technical analysis and cycle theory confluence along with the global macroeconomic and geopolitical landscape can help form a view of the current 8-year cycle.
Geopolitical and Macroeconomic Landscape
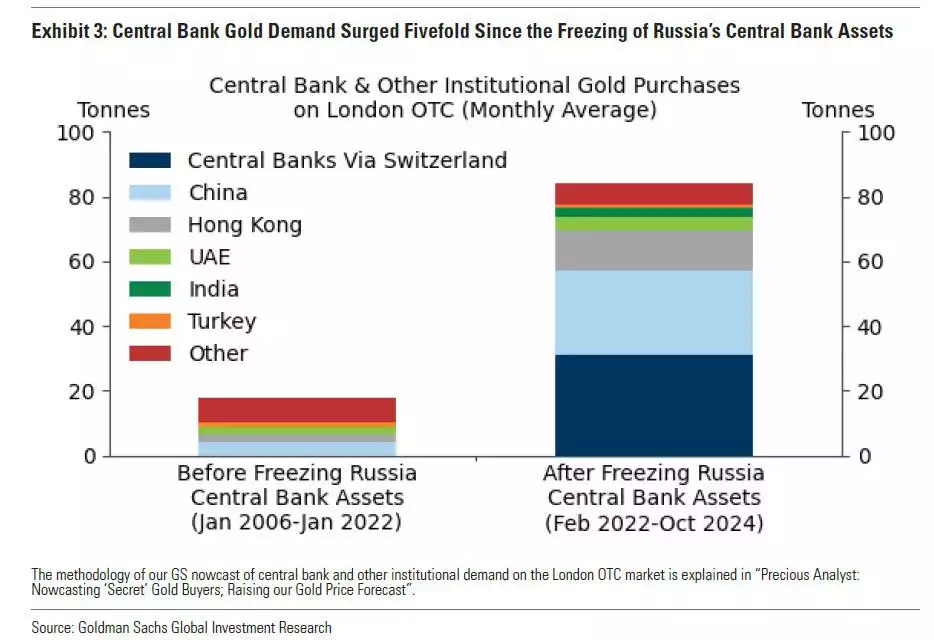
Since the US weaponised the dollar against Russia in 2022, as a response to the Ukraine conflict, global central banks have been stockpiling gold at 5 times their usual speed, to diversify away from the US dollar, as their primary safe haven collateral.

While central banks have been diversifying away from US debt for years, Moody’s rating agency has recently downgraded US debt from AAA to AA+ (the last of the three major credit rating agencies to do so).
In addition, Credit Default Swaps on US debt have shot up from $29k to $51k per $10m. These are essentially the cost of insuring US bonds against collapse and rising insurance premium indicates increased risk.
These quiet changes occurring in plain sight are amid a technical and cyclical backdrop that strongly favours a long-term uptrend in gold.
Technical Indicators
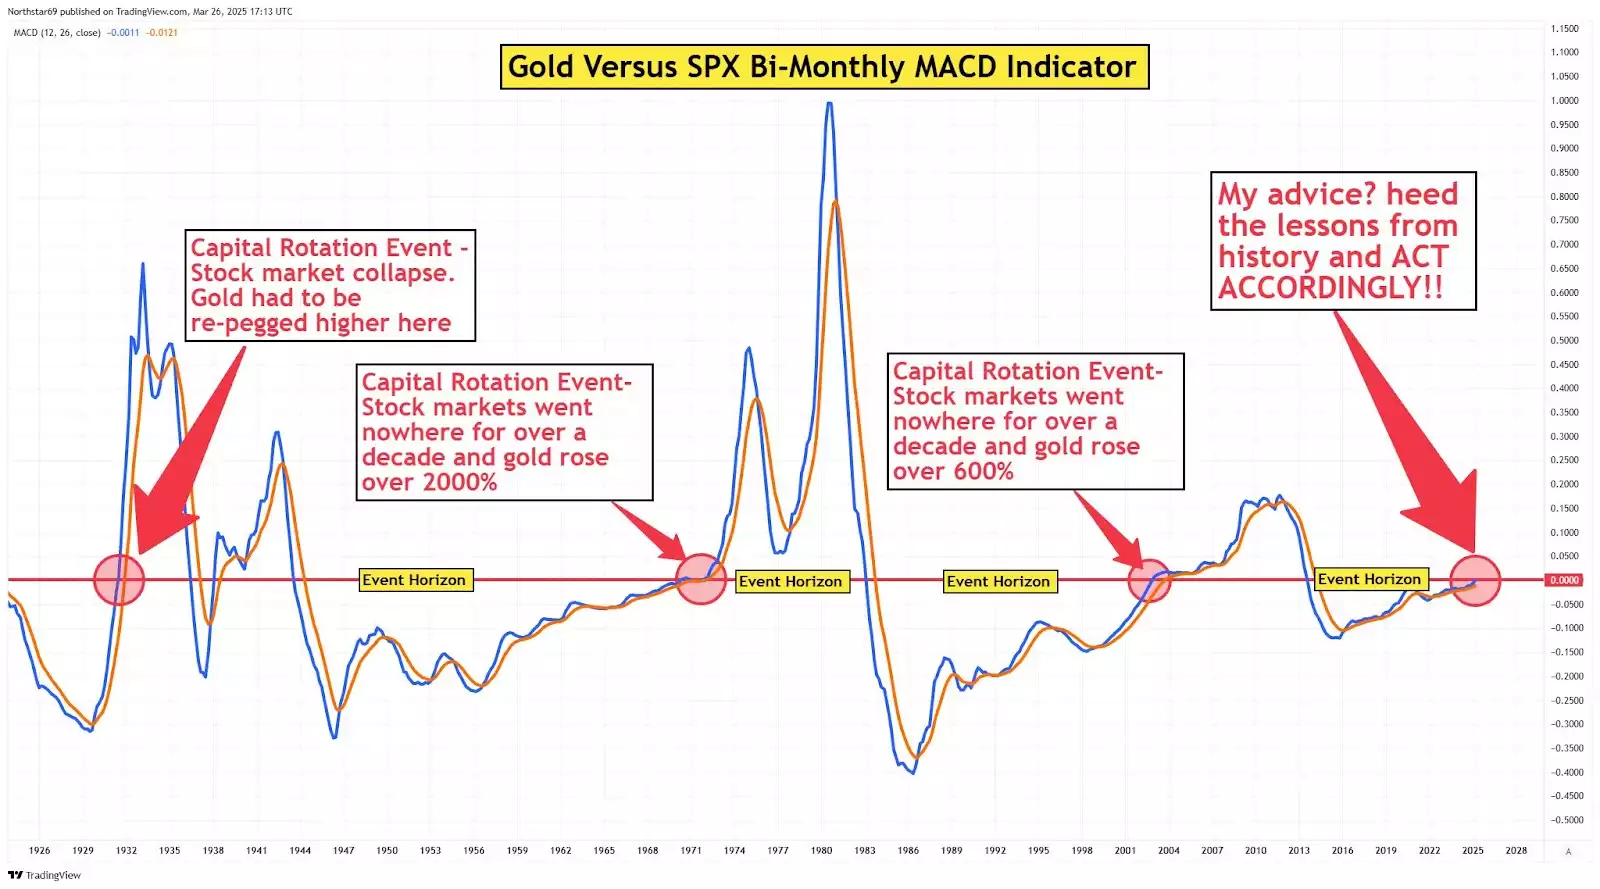
Looking below at the gold vs S&P500 bi-monthly MACD indicator, we notice only four times in the past 100 years, where it crossed to the upside, after a prolonged period below zero, each marking a significant event in global financial markets.

Source - @Northstarcharts
Each of these four events led to stock markets going sideways, remaining in a range for about a decade, while precious metals significantly outperformed.
On the chart below, we can note that this phase is marked by the Stochastic RSI (a technical indicator used to identify overbought and oversold conditions) resetting from overbought to oversold on the 12-month chart.

Cycle Theory Confluence
18.6-year land cycle
This cycle is based on 350 years of UK and US land data. Made up of approximately two 7-year uptrends followed by a crash and a 4-year recovery phase land markets, we are currently in the final stages of the second 7-year uptrend.
In this final phase, coined the “winner’s curse”, most assets rise together amid increasing leverage and complacency, followed by a broad-based financial crash.
In the final stages of the 18.6-year land cycle and the recovery from the crash gold and silver have historically outperformed, while most other assets (land and stocks included) have gotten overvalued, crashed, and then spent years trying to recover.
80-year socio-economic cycle
The “Fourth Turning” is a thesis formulated by historians Neil Howe and William Strauss in 1997, suggesting that society moves in 80-year macrocycles, made up of 4 sub-cycles called “turnings” - with each turning lasting about 20 years - and having its own generational archetype, specific role to play, and predictable result. Currently, we sit in the fourth turning.
During the fourth tuning, society is expected to address a range of major crises, head-on and create a new system by the end of it, leading into the first turning of the next 80-year cycle. This phase is characterised by wars and financial collapse which lead us into a new world of optimism, hope, and unity.
During the transition from one 80-year cycle to the next, investors seek an asset that has been used for thousands of years - such as gold and silver - to navigate this transition safely.
After the previous fourth turning (end of WWII) gold and silver embarked on a 35-year-long bull run, with the gold-to-silver ratio spending decades below 50 and silver putting in a centennial price increase.
8-year DXY cycle
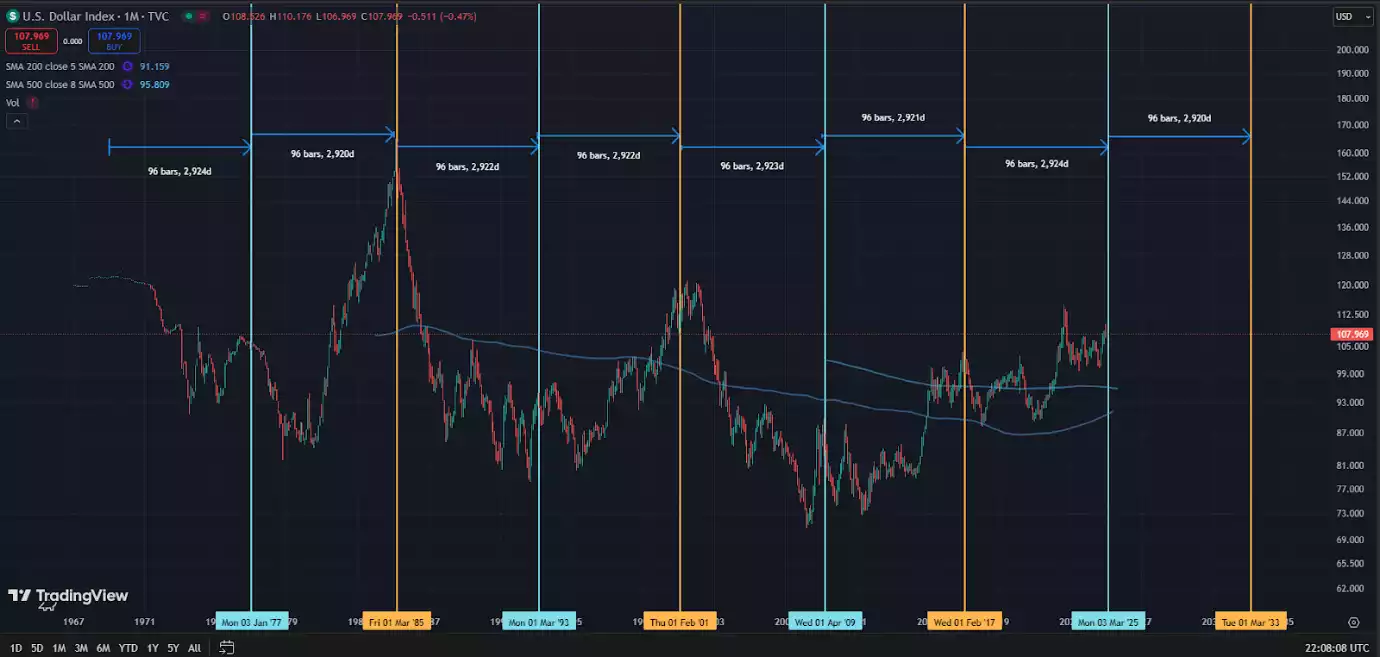
Similar to gold, the DXY has also been putting consistent cycles since the end of Bretton Woods. While the DXY cycle is 16 years, it can be broken up into two 8-year sub-cycles marked below.

This cycle helped favour the likelihood of a fall in the DXY in March of this year, while most investors were concerned about an uptrend in dollar strength amid Trump’s USA first policies.
We can also see the approximate expectation for a rise in the DXY into the cycle-low timeframe of 2030 for gold, in line with their inverse relationship.
What’s compelling is the clear indication that the DXY could significantly fall off after 2033, right on time for gold’s next 8-year cycle! This would favour a strong uptrend in gold to start the next 8-year gold cycle as well.
While we are not only early on the current 8-year gold cycle, but the next one might also bring the most significant gains amid the DXY falling off significantly in that timeframe.
This provides a decade-long view of the asset, showing a major runway ahead.
While most call for tops on every run-up along the way, or feel like they are “too late”, zooming out helps us realise that in the macro picture, we haven’t seen anything yet for gold.
Watch the insights video inspired by this article here: https://www.youtube.com/watch?v=8gtUgsuoYX0