Gold – Why This Time is Different to GFC
News
|
Posted 09/04/2020
|
29210
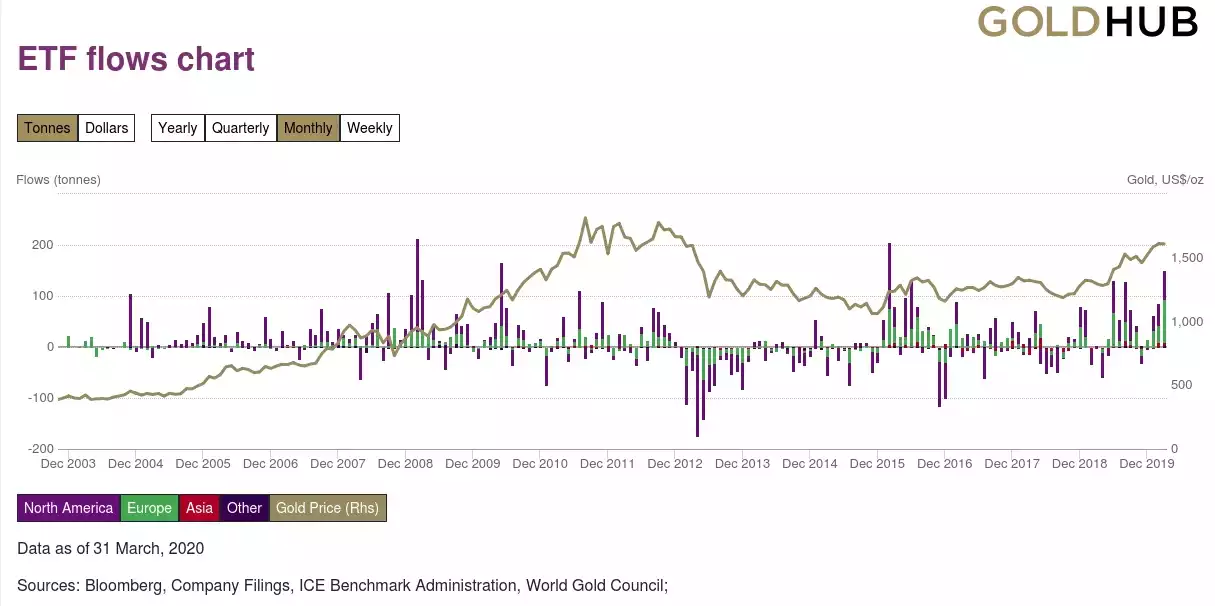
Whatever the shortcomings and counterparty risk of ETF’s may be, the fact remains they have become a large source of demand for gold. Anyone who tried to buy physical bullion in March would not be surprised to know that ETF’s globally saw an incredible 151 tonne or $8.1b of gold added in the month. That’s the highest since 205 tonne was added in February 2016 and combined with the higher gold price, saw the 1st quarter of 2020 as the highest quarter in value since the ETF’s came into existence in 2003. On an annualised basis, the past year saw 659 tonne added, the highest since the GFC.
The chart below shows the inflows and out since ETF’s became a thing in 2003. The previous month high was February 2016 just a few months after the beginning of this secular gold bull market that started with the low of just US$1062 in November 2015 to now sitting at US$1650, up 36%.

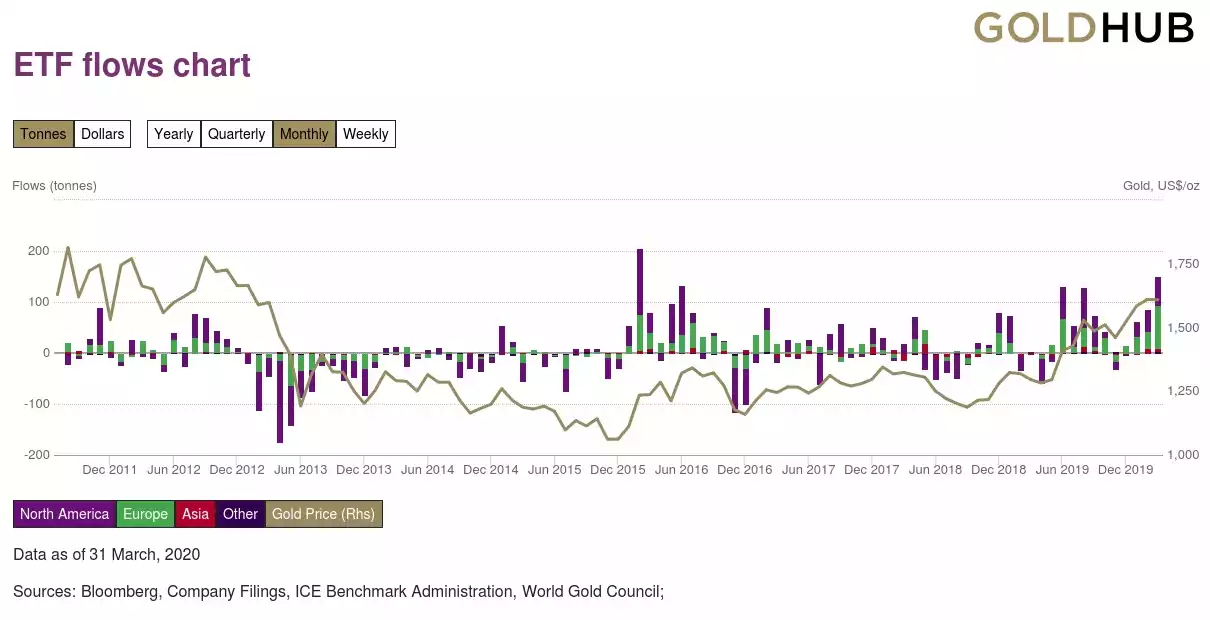
Zooming in a little it is interesting to note a couple of things.

Gold hit its all time high price of US$1814 in August 2011 driven in part on an assumption all the money printing by the Fed was going to cause high inflation and wouldn’t work to resurrect the GFC issue. What they didn’t realise was that all that money was going to just inflate sharemarkets and property instead of the general economy. Wall St became rich and Main St languished. There were also a lot of participants still in from the GFC safe haven play that were sitting on 150% gains if they bought the exact same liquidity squeeze dip in October 2008 that we are currently experiencing. We also saw the “resolution” of the Euro debt crisis in 2012 (ahem… with more debt). Finally, we saw the Fed commence QE3, it boldest and open ended money printing program that was sure to re-inflate shares that were languishing after the last QE was turned off. “Don’t fight the Fed” was the mantra, sell your safe haven and pile into US shares surely about to take off again on free money. And so in the same month QE3 started, we then had that epic sell off seeing gold fall from US$1776 in September 2012 to just US$1192 in June 2013. The 10 year secular bull rally was over. You can see the massive sell off of ETF’s over that period in the chart above and the bouncing along the bottom until November 2015 when this bull market commenced.
Many analysts also point the finger at the passive, automatic, quantitative, algorithmic trading systems as the largest contributor to the depth of that sell off. We have written at length about the explosion of these algorithmic / quantitative passive funds and the very real and very large danger they present to ALL markets now. From our last article quoting JPMorgan's global head of quantitative and derivatives strategy, Marko Kolanovic:
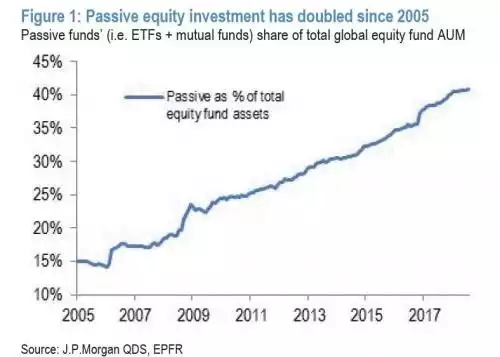
“Shift from Active to Passive Investment. We have highlighted the growth in passive investment through ETFs, indexation, swaps, and quant funds over the past decade, transforming equity market structure and trading volumes. For instance, as of May 2018, total ETF assets under management (AUM) reached US$5.0 trillion globally, up from US$0.8 trillion in 2008. We estimate that Indexed funds now account for 35-45% of equity AUM globally, while Quant Funds comprise an additional 15-20% of equity AUM. With active management declining to only one-third of equity AUM, we estimate that active single-name trading accounts for only ~10% of trading volume. We estimate ~90% of trading volume comes from Quant, Index, ETFs, and Options. The shift from active to passive asset management, and specifically the decline of active value investors, reduces the ability of the market to prevent and recover from large drawdowns. Figure 1 illustrates the trend in passive assets, showing the growth of passive equity fund AUM as a % of total equity fund assets since 2005.”

As you can see from the chart the percentage of these passive funds since 2013 has grown strongly.
We raise all this for a number of reasons. Firstly, any logical analysis of the current global economy amid this crisis could only conclude things are going to get a lot worse economically. Explain then the recent bull trap sharemarket rally (discussed here and here) amid such fundamentals? (up another 3.4% last night). This is a classic example of the effects of this blind momentum trading through passive, not actively analysed funds. Things can spiral up just as they can spiral down. It is the spiral down prospect that is most scary. If you are the majority of the market and all on the same side of the boat, the bid effectively disappears and so goes down the spiral / boat. The Fed and central banks around the world are doing all they can to recreate the effects of QE3. However this time we have massive fiscal stimulus at play as well through governments handing freshly created cash directly into the broader economy. This helicopter money fundamentally changes the inflation narrative. We didn’t see inflation during QE1-3 because it went straight to banks and their high end clients’ share accounts. This time is different and inflation at the end of this is a very real prospect. Additionally the depths of the recession we are entering promise to be far far deeper than that of the GFC.
Gold thrives on either scenario and hence the relentless gold ETF buying by the same Wall St types buying shares when they know the fundamentals don’t support it. Maybe, just maybe blind faith in the Fed’s abilities and the ‘surely this virus thing will end soon’ narrative will see a solid bull trap bounce extend. But they clearly want their gold insurance as well as they inevitably end.