Gold Technical Analysis
News
|
Posted 20/06/2025
|
8799
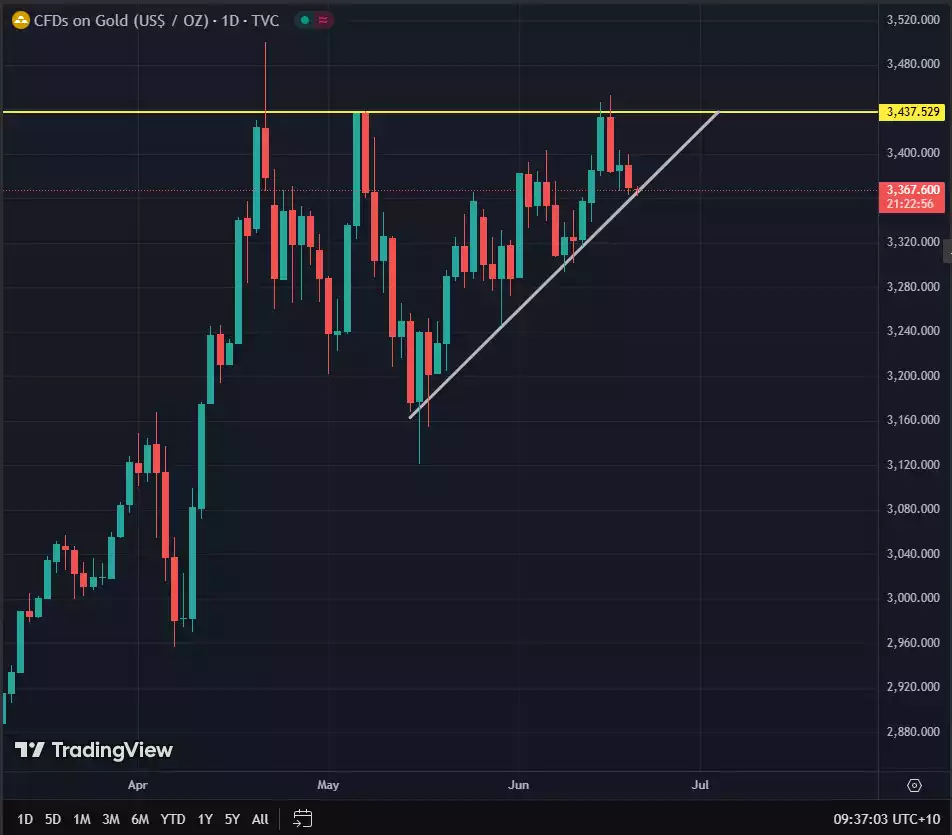
For the last month, gold has been forming a bullish pattern that may indicate another move upward. The current day’s closing price could either keep the pattern intact or lead to a breakdown.

The above picture shows a daily candle chart of the price of gold in USD. The yellow flat line is a major resistance level, or “price ceiling” which gold has been bouncing down from. The angled white line highlights the potential bullish aspect of the pattern: Gold’s price drops have been getting smaller and smaller. Despite having repeated selloffs around the US$3,437 mark, the selloffs have been getting bought up at increasingly closer levels which indicates the increasing appetite of buyers. This pattern is called an “ascending triangle” and often leads to the price tightening into the corner and then breaking out upward in continuation of its previous rise.
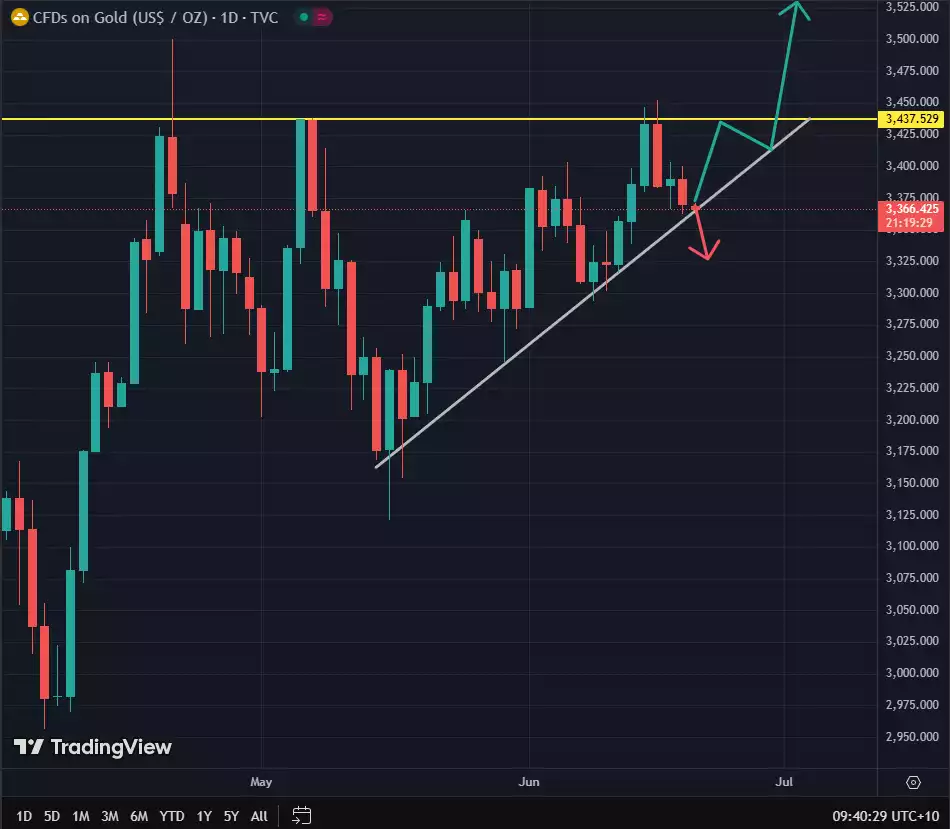
Here are two example scenarios to look out for:

If today’s daily candle dips below the white trend line and closes there, this would indicate a potential failure of the pattern and could be warning of a fall or sideways price movement. However, if the pattern continues as it has for the last month, this could indicate another breakout upward and further price discovery.
One of the major factors here is what ends up happening with Trump’s back-and-forth about bombing Iran. It has been rumoured that Israel would need the help of a US bunker buster to effectively destroy an underground nuclear refinery, but Trump has been keeping his cards very close to his chest. The NYT also just published a story claiming that if Fordow is attacked or Khamenei is killed, this may lead to them wanting a nuclear bomb. The illogical part of this story is that Israel and the US have already assumed Iran wants a nuclear bomb, but now their desire somehow hinges on these details. We may be witnessing a bit of misdirection, which is something Trump recently bragged about after Israel’s surprise attack came days earlier than expected.
Until further action happens in Iran, traders can look to the above pattern for clues.