“Gold Supply Cliff” adding fuel to Gold Price Rocket
News
|
Posted 19/12/2022
|
14394
There are many factors converging to form a bullish scenario for gold on the demand side but how about from the supply side? A large part of what makes gold such a sought after store of wealth is its incredibly tight supply. Since the GFC the contrast between the supply of freshly printed currencies (incorrectly called ‘money’) and that of hard to mine gold (real money) has been unprecedented. Today we look at how that mine supply looks set to get even worse.
Crescat’s Otavio Costa tweeted over the weekend exactly to that topic:
“Some brief history first.
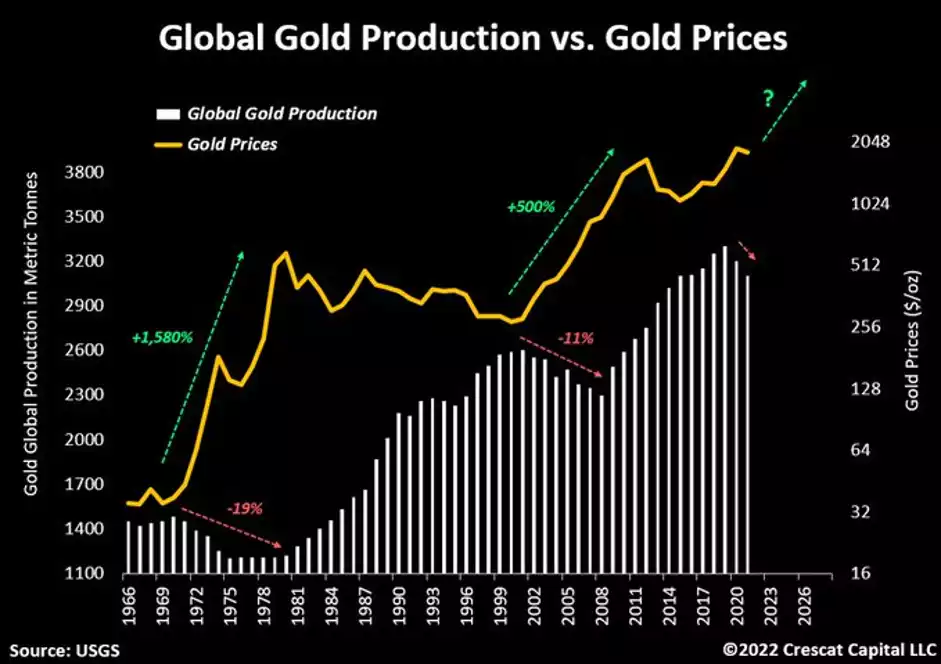
Since the end of the Bretton Woods system in 1971, there have been two major gold bull markets:
A raging one in the 1970s and another substantial one in the early 2000s.
Among the multiple idiosyncrasies causing the metal price to rise in each of them, one key macro driver precipitated the move higher in both:
A multi-year decline in gold production worldwide.
These contractions had a significant impact on fueling the strength and length of prior gold cycles.
Today, we see the same macro development unfolding.
Global gold production has been falling since 2019 and is likely in the early stages of a new secular downtrend.
Miners that have traditionally focused on precious metals have been redirecting their capital to battery metals and other mineral resources that comply with the green agenda. Many gold-focused miners have significantly shrunk their production.
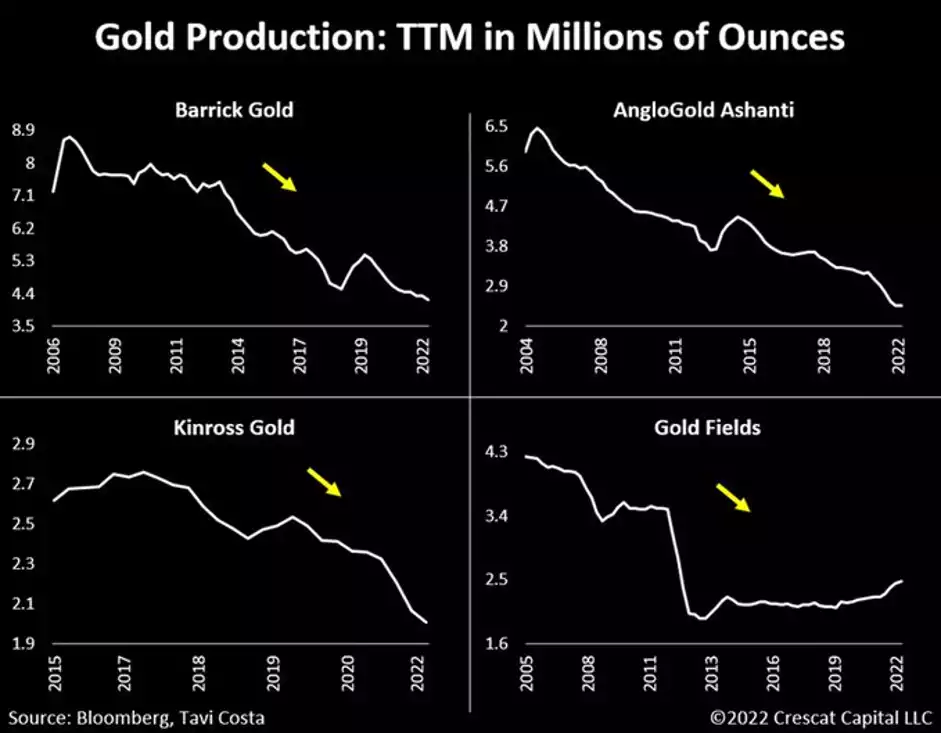
Newmont, for example, the largest global gold miner, is merely producing the same amount of gold it did 16 years ago while its reserves are down 24% from their peak in 2011.
These supply constraints magnify the bullish long-term investment case for precious metals.”
That of course is looking backward, the following chart shows the setup for the future with next to no large new gold deposit discoveries in the last 5 years.

As Otavio points out, there has been a sharp drop in new funds deployed to gold exploration. The following chart illustrates that clearly, and you will see that this time the gold price has broken from that historic correlation. That is due to huge demand side of things, and now the diversion of funds from exploration sets up this epic future setup of constrained supply as well.
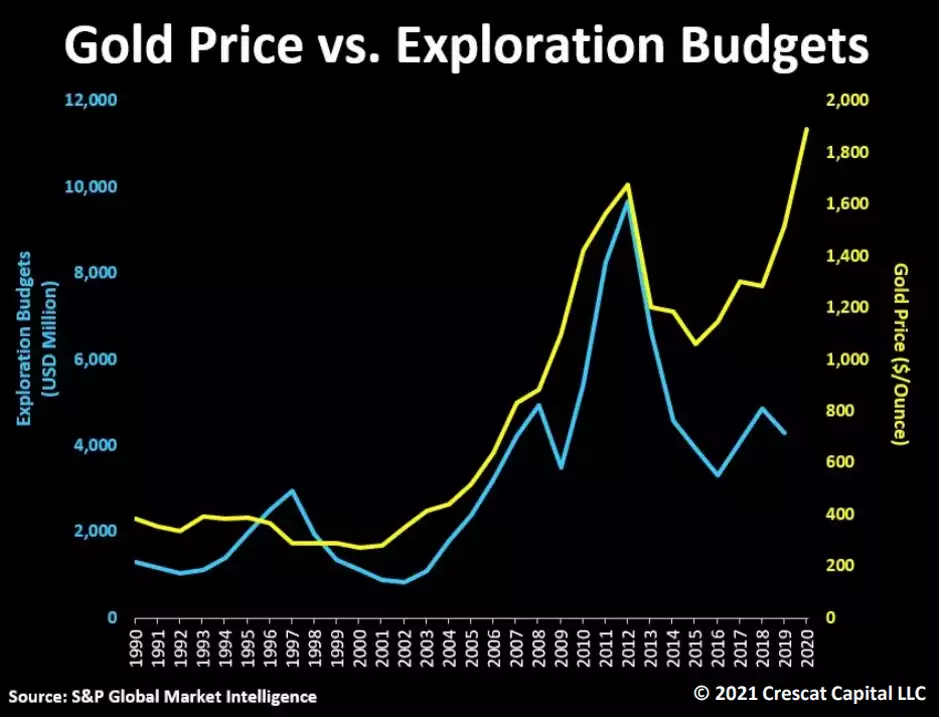
And so, looking forward we have this illustrated very clearly below with the proverbial and precipitous gold supply cliff before us:

Of course it is not all about miner money going to dig up stuff for batteries and electric motors, since 2020 we have seen a massive fall in the broader commodities index versus the S&P500. Simply put, all that ‘free’ freshly printed money was pouring into growth shares and not value like commodities. Cue the Fed reversal of free money and inflation and we can see that fall halting and in the process of reversing.
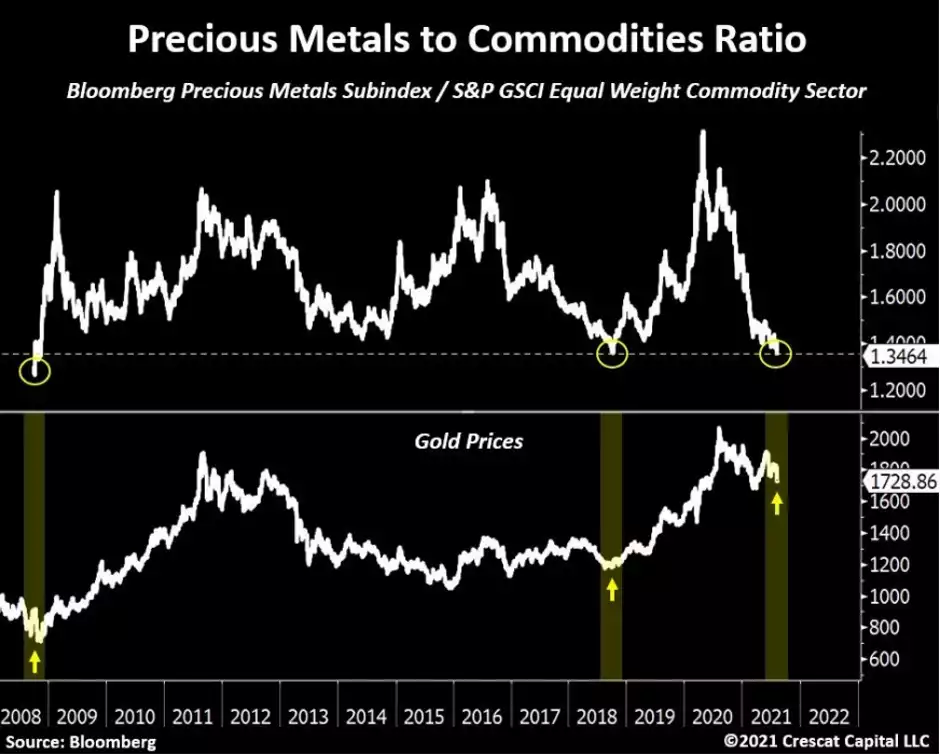
What is notable also in the above chart is that such reversals have marked the beginning of gold price rallies. Furthermore, silver is both monetary metal AND commodity/industrial metal AND the gold silver ratio is currently at a very high 77:1.
As the global economy hurtles toward recession, sticky inflation and the inevitable and too-late reversal of central bank policy, the demand setup for gold and silver is enticing enough. Adding these supply parameters just makes the Economics 101 formula of price v demand / supply so incredible right now.