What the 18-Year Land Cycle Theory Says About the Next Downturn
News
|
Posted 26/08/2026
|
315
Key Takeaways
- A heterodox economic theory holds that land prices move in roughly 18-year cycles of expansion and bust, with a smaller slowdown partway through.
- Proponents map the theory onto the 2001 dotcom crash and the 2007-09 Global Financial Crisis (GFC), and argue today's setup looks similar.
- The theory has genuine academic supporters, but critics say its forecasting record rests on too few data points to be reliable.
- Gold and silver have historically performed strongly during and after major systemic downturns, though past performance is not a guide to future results.
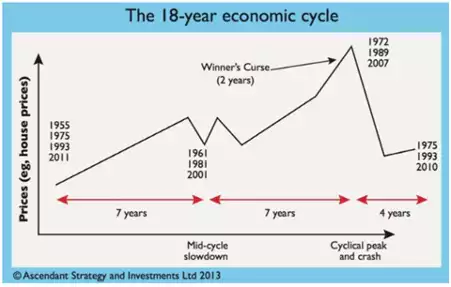
A niche but persistent school of economic thought argues that land and property prices move in a repeating cycle lasting somewhere between 18 and 20 years: roughly 14 years of rising prices, interrupted by a milder mid-cycle slowdown, followed by a sharper multi-year downturn. Some analysts who follow this theory believe current conditions, record equity valuations built around AI, an ageing property cycle, and elevated government debt, resemble the setup before the 2007-09 GFC.
Where the theory comes from
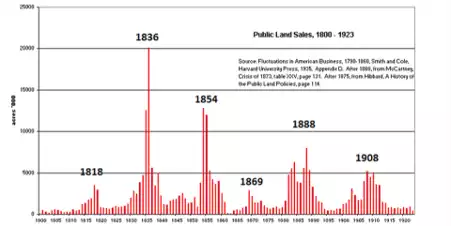
The land cycle idea traces back to US economist Homer Hoyt's 1933 study of Chicago land values, and has been developed since by economists including Fred Foldvary, Fred Harrison and Phillip Anderson. Foldvary's most cited call came in 1997, when he predicted the next major property bust would land "around 2008", roughly 18 years after the early-1990s downturn.
Proponents point to a repeating pattern: rising land and credit fuel an expansion, interrupted by a milder recession partway through, before a larger downturn when the cycle turns. They argue the 1990s-2007 expansion fits this shape, with the mid-cycle slowdown coinciding with the 2001 dotcom crash and the cycle's end coinciding with the 2007-09 GFC.
Looking at recent history
The dotcom crash saw the Nasdaq fall roughly 78% from its March 2000 peak to its October 2002 low, driven by a collapse in internet-stock valuations rather than a systemic credit event. The GFC that followed later in the decade was different in kind: a collapse centred on US mortgage and land markets that spread through the global banking system, with the S&P 500 falling roughly 57% peak to trough between October 2007 and March 2009.
Land cycle proponents argue today's combination, an ageing property cycle alongside concentrated AI-driven equity valuations, could produce a downturn that combines features of both: a valuation-driven shock like 2000, layered on a systemic credit event like 2008. Some go further and overlay this with separate generational cycle theories, such as the Strauss-Howe "Fourth Turning" framework, to argue a broader multi-decade cycle is also turning. That theory has its own following, but it is distinct from the land cycle argument, contested among historians and economists, and its critics have described it as narrative pattern-matching rather than a testable forecasting tool.
The case for scepticism
Not everyone accepts the land cycle's forecasting power. Critics point out the theory has produced roughly ten identifiable cycles over 225 years, too few data points to establish a reliable statistical pattern, and that the proposed 18-year interval has ranged anywhere from 14 to 20 years in practice. The 1970s alone saw conflicting peaks in 1973, 1979 and 1989 that proponents have struggled to fit neatly into the framework.
What is better supported is the underlying mechanism rather than its precise timing: rising land values encourage more lending, more lending inflates land values further, and the cycle eventually breaks when credit conditions tighten. Credit-fuelled booms and busts are well documented in economic history. Whether they arrive on a predictable 18-year clock is a separate, more contested claim.
What history shows about gold and silver
Whatever the merits of cycle timing, gold and silver both have a long record of performing strongly through periods of systemic financial stress. During the GFC, gold rose from around US$700 an ounce in 2008 to an all-time high of US$1,917.90 an ounce in August 2011, according to US Bureau of Labor Statistics data.
The metal's biggest historical re-rating came after the US left the gold standard. Gold was revalued from US$20.67 to US$35 an ounce under the 1934 Gold Reserve Act and then held fixed for decades. Once it was allowed to trade freely again after August 1971, it rose to a peak of US$661.50 an ounce by February 1980, a roughly nineteen-fold increase over the period once currencies were no longer tied to a fixed gold price.
What it means for investors
None of this amounts to a forecast. Cycle theories, whether based on land prices or generational change, are historical pattern-matching exercises, and even their proponents acknowledge the timing is inexact. Whether the next downturn resembles 2001, 2008, both, or neither, is unknowable in advance.
What the historical record does show is that gold and silver have tended to hold or grow their value through past periods of financial stress, which is one reason many investors hold physical bullion as a diversifier alongside other assets, rather than as a bet on the timing of any particular cycle theory.
This article is general information only and does not constitute financial advice. Past performance is not indicative of future results. Always conduct your own research or consult a licensed financial adviser before making investment decisions.