Gold: Dip or Detour?
News
|
Posted 24/10/2025
|
3115
Gold has had an ostentatious boom this year, and we’re finally seeing a much-awaited pullback. Will the dip continue much longer, or are we due for a rebound? Let’s see what some indicators are telling us.

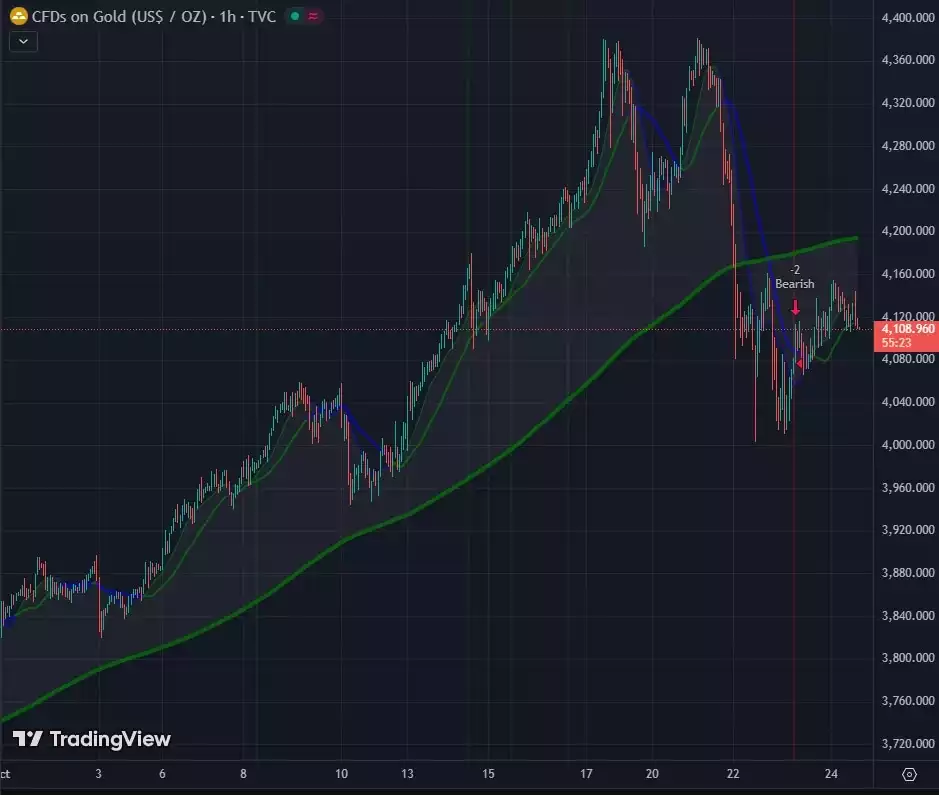
Recently, we’ve seen a retracement that has pared back October’s gains but still leaves gold substantially higher for the month. A bearish candle pattern on the hourly chart highlights recent weakness and shows there may not be an immediate recovery (i.e., within the next 24 hours).
The abrupt fall has been slowed, however, with some choppy, sideways movement that has turned the shorter moving averages back to green.
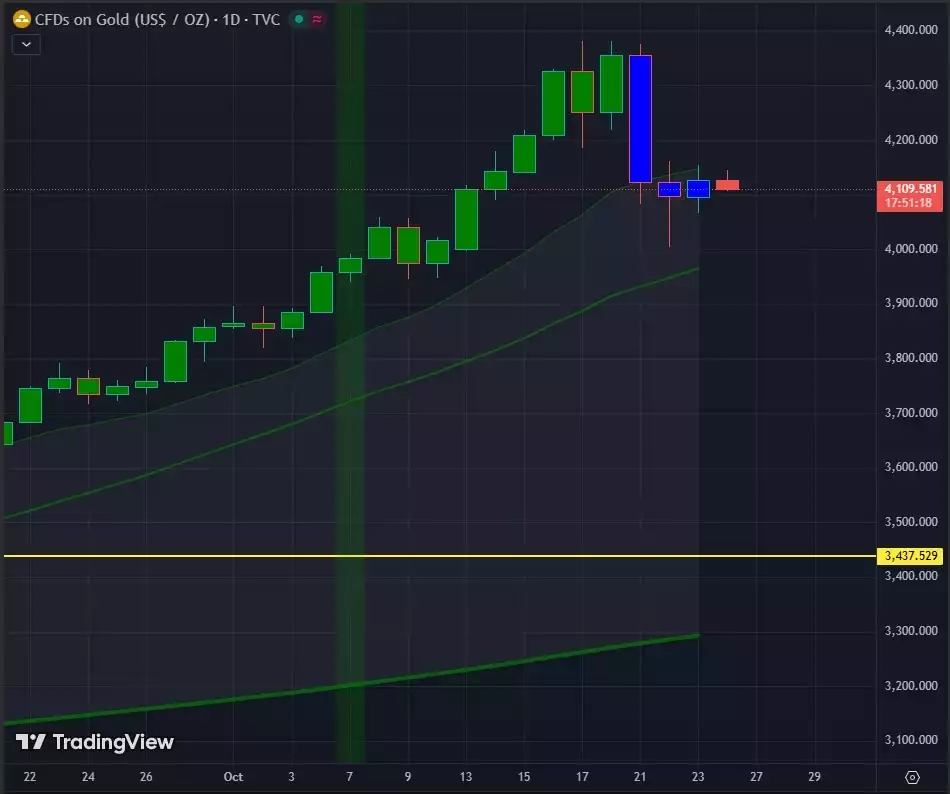
The daily chart paints a slightly different picture:

What we see above is a combination of moving averages and MACD data (essentially how these lines diverge from each other) dictating the colour of closed trading sessions “Looking at the last three days -each a decline - the candles appear blue, which implies that the pullback is likely an anomaly within an ongoing move higher.
Purely based on this range of indicators, the price action in the short-term looks weak. The longer term using the same indicators looks like normal pull back inside of a continuous bull run.