Gold Demand for ETFs Rolling On
News
|
Posted 15/10/2024
|
1458
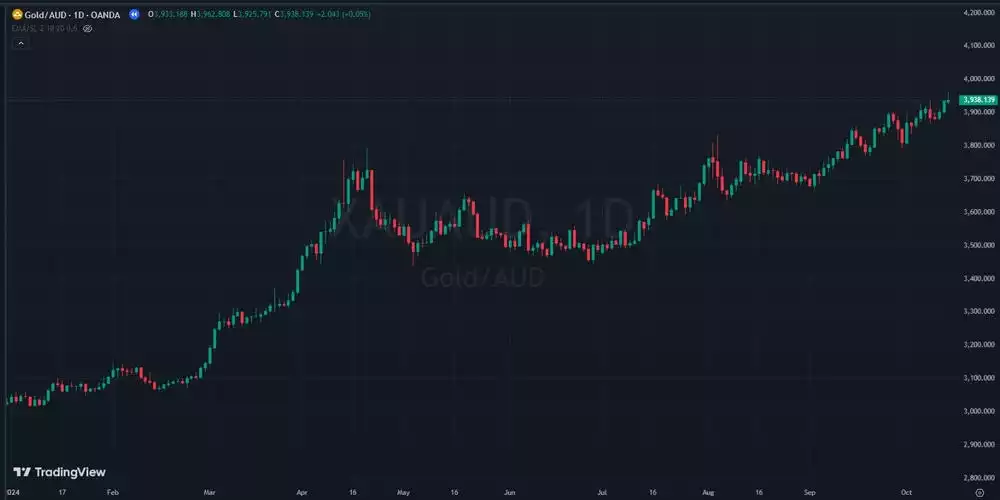
As the world holds its breath for Israel’s retaliation to Iran’s recent missile attacks, gold has continued to charge upward this month with the backdrop of chaos in the Middle East, among other macro factors.

Gold-backed ETFs account for a significant part of the gold market, with institutional and individual investors using them to implement many of their investment strategies.
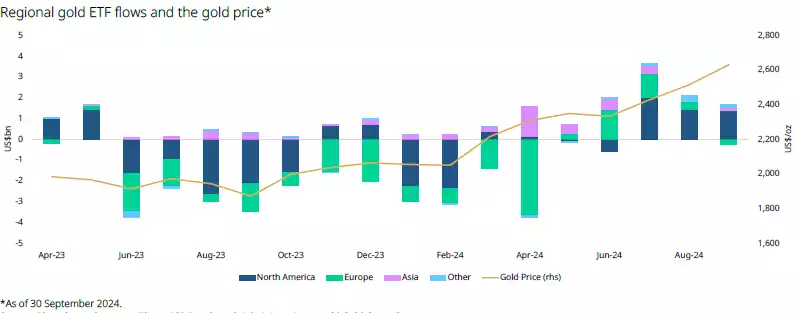
Fresh data from the World Gold Council shows that physically backed gold ETFs saw their fifth consecutive monthly net inflow in September, attracting US$1.4bn of inflows. The positive result was largely due to significant inflows in North America, while Europe was the only region that experienced (mild) outflows. The continuous inflows in recent months have helped gold ETFs to flip positive to US$389m year-to-date. The Asia region has again shown itself to be a consistent bull with its 19th consecutive month of net inflows.
The data for September culminates in 3,200 tonnes of total gold supply now stashed away for physically backed gold ETFs.

Source: Bloomberg, ICE Benchmark Administration, World Gold Council
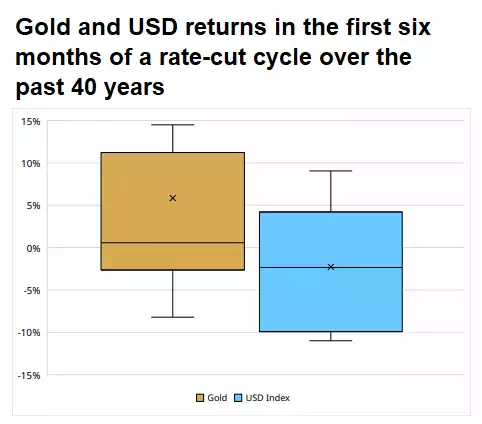
As we expected when the first major U.S. rate cut began to take shape months ago, it’s had a positive impact on price in conjunction with other macro drivers. Not that we needed it – but the World Gold Council has driven home the point with the below data. As you can see, gold has historically returned an average of 6% in the six months following the start of rate-cutting cycles (represented by the “x” on the chart below).

Source: Bloomberg, ICE Benchmark Administration, World Gold Council