Gold Demand Trends Q3 2022 – record Central Bank buy up
News
|
Posted 03/11/2022
|
16929
Its that time again when we check the pulse of the global gold market through World Gold Council’s quarterly demand report. It was a quarter of consumers and central banks (buying) v Wall Street (selling). Lets get into what they said…
In summary, gold demand (excluding OTC) in Q3 was 28% higher y-o-y at 1,181t. Year-to-date (y-t-d) demand increased 18% vs the same period in 2021, returning to pre-pandemic levels.

Investment
Bar and coin investment jumped, while gold ETFs saw a second consecutive quarter of outflows
- Global gold-backed ETFs saw outflows of 227t in Q3 – the largest since Q2 2013 – as investors focused on rising rates and a stronger US dollar
- Over the year to end-September, flows in the gold ETF space were virtually flat, having almost fully reversed the January-April inflows
- The bar and coin sector had its strongest Q3 since 2011, with a very healthy 351t of demand.

The investment environment for gold in Q3 was dominated by widespread, multi-decade high inflation and the resultant impact on interest rates. Bar and coin investors focused on the former and sought the safety of gold as a hedge against inflation. Gold ETF investors, in contrast, reduced their holdings as they focused on gold’s rising opportunity cost in the face of hefty rate hikes from central banks globally and a surge in the US dollar. Along with ETF outflows, OTC investment softened and managed money futures positioning on Comex moved temporarily to net short for the first time in three years.

By region of note:
- Bar and coin demand in China almost doubled to 70t from the previous quarter’s COVID lockdown-induced slump.
- Indian bar and coin demand saw a 6% y-o-y improvement as retail investors responded to lower local gold prices and weaker equity markets.
- The Middle East generated the highest level of quarterly retail investment for four years, up 64% y-o-y to 26t. In line with the broad global themes, rising inflation and the opportunity to buy on a dip in the price were major factors driving investment during the quarter.
- Retail investment in Turkey was exceptionally strong in Q3, increasing more than fivefold. At 47t, it was the second highest quarter in our data series. Record inflation combined with stable lira prices brought about a surge in demand, and this gained pace on price pullbacks during the quarter.
- Bar and coin investment demand in the US remained elevated – up 3% y-o-y at 25t. US mint coin sales y-t-d are the highest since 1999. As consumers express increasing pessimism about the state of the US economy amid increasing inflation, investment demand has been supported by gold’s role as an inflation hedge. The following is a result of their recent US consumer survey:
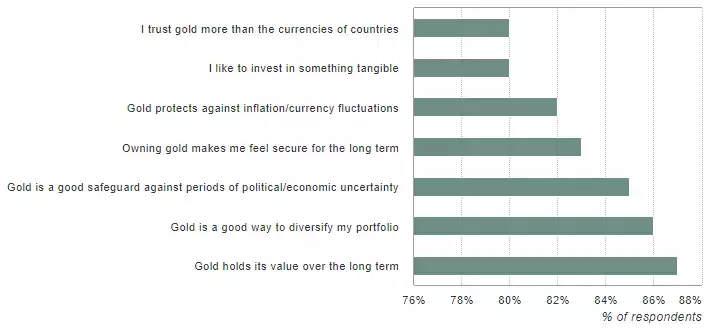
- European retail gold investment was 28% higher y-o-y at 72t. Slowing growth across much of the region, war on the doorstep and monetary authorities managing a delicate balance between hiking rates enough to curb inflation without tipping the region into sharp recession, has encouraged continued flows into gold. Demand in Germany gained 25% y-o-y, to reach a y-t-d record of 131t.
Jewellery
Global gold jewellery consumption recovered to pre-COVID levels
- Q3 demand benefitted from a pullback in the gold price
- India led the recovery with 17% y-o-y growth in demand to 146t – the strongest third quarter since 2018
- Demand in China saw more muted growth, up 5% y-o-y as sporadic COVID-related restrictions impaired consumer sentiment.


Central Banks
Central bank buying hits all-time quarterly record in Q3’22
- Q3 net demand includes substantial estimate for unreported purchases
- Turkey, Uzbekistan and Qatar amongst the biggest reported buyers during the quarter
- This lifts y-t-d net purchases to 673t, surpassing all annual totals since 1967

Global central bank purchases leapt to almost 400t in Q3 (+115% q-o-q). This is the largest single quarter of demand from this sector in our records back to 2000 and almost double the previous record of 241t in Q3 2018. It also marks the eighth consecutive quarter of net purchases and lifts the y-t-d total to 673t, higher than any other full year total since 1967. 1

Technology
Rapidly deteriorating consumer confidence hits demand
- Gold used in industrial applications fell by 8% y-o-y to 77t, the weakest third quarter on record
- The electronics sector, which dominates industrial demand for gold, fell by 9% y-o-y to 63t
- Consumer demand has weakened dramatically during what is typically peak season for the electronics sector

Supply
Total Q3 supply increased by 1% y-o-y as lower recycling offset mine production growth
- Q3 mine production increased to almost 950t, up 2% y-o-y following the recovery in Chinese output and fewer technical difficulties elsewhere
- Recycled gold supply fell 6% y-o-y, primarily due to lockdowns in China and limited signs of distress selling in other markets
- On a y-t-d basis, total gold supply increased 3% y-o-y.
Gold mining costs continued to increase in Q2’22, the latest available data. The average All-In Sustaining Cost (AISC) hit US$1,289/oz in the second quarter, another record high and up 18% y-o-y. General inflation increased mining costs in all areas with fuel, energy, labour and consumables all up y-o-y.
So let us leave you with this observation on all of the above. Gold mine supply is ‘strong’ at 2% per year additional gold in the system. By comparison, just one central bank, per the chart below, the one printing all the world reserve currency, has risen on average 57% per year or 1136% in total. And just who are the biggest buyers right now? Central banks. Who are the big sellers? Wall St selling gold ETF’s for the very debt instruments behind this financial ponzi scheme. Who are the other big buyers? The growing number of mum and dad investors, home offices and SMSF’s not buying the BS and buying real, hard assets in advance of what is most inevitably coming.

************************************************************************************
GOT A QUESTION about today's news?
This afternoon, the Gold & Silver Standard Insights team will be breaking down the news and answering YOUR questions.
Submit your question to insights@goldsilverstandard.com and SUBSCRIBE to the YouTube Channel to be notified when the GSS Insights video is live.
**********************************************************************************