From Bear to Bull: Analysing the Transition Phases of the Digital Asset Market
News
|
Posted 07/03/2023
|
12045
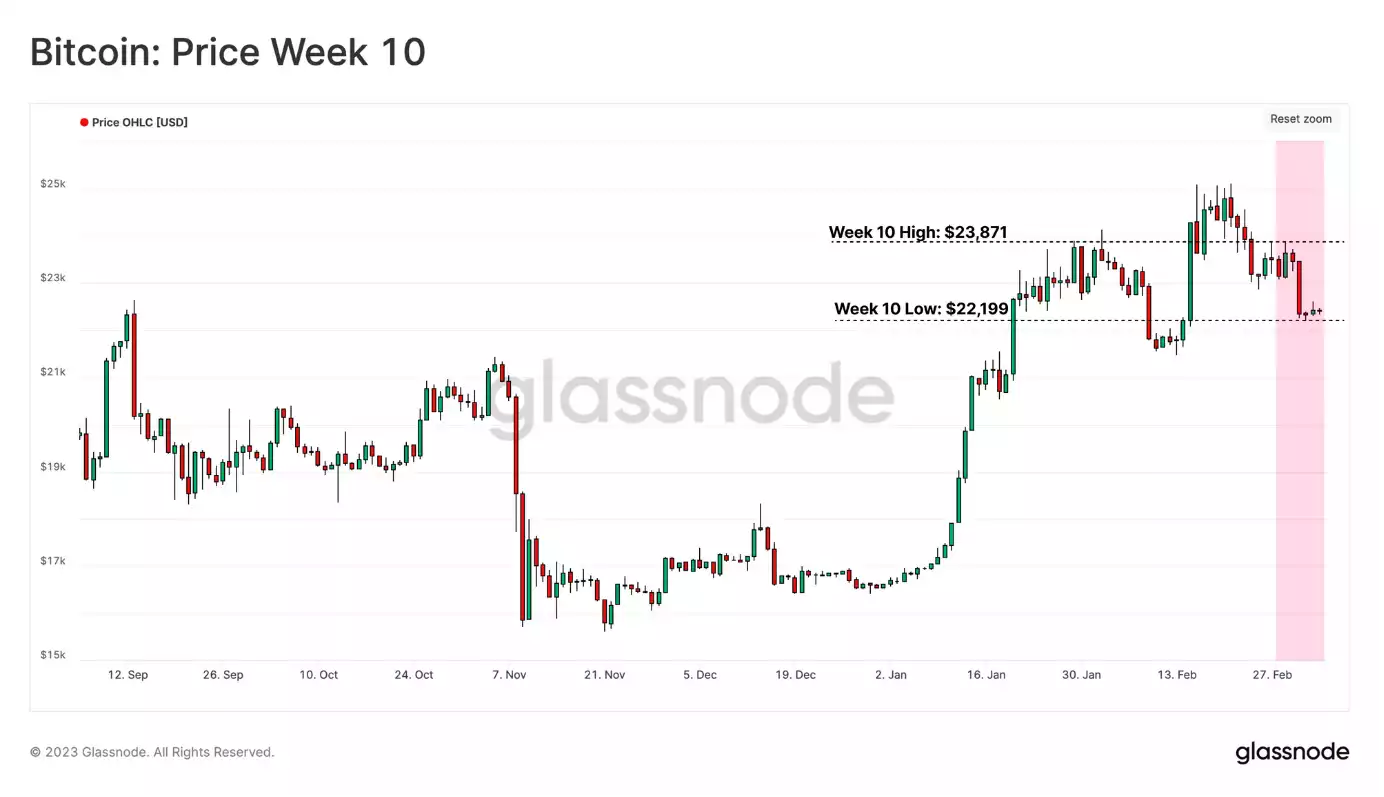
Despite the recent rejection of Bitcoin prices from psychological on-chain levels, there is reason to remain optimistic about the digital asset market. The levels in question are associated with both Older hands from the 2021-22 cycle and the Whale cohort, indicating that significant players are involved in the market. Profit-taking and capital flows have started to occur, which is a natural aspect of any market. While there has been a fall in prices from a high of $23,871 to a weekly low of $22,199, it is important to note that the weekly high coincides with several psychologically important realised price levels. These levels are related to both Older holders from the last cycle and Whale entities, suggesting that they have a vested interest in the market's success. Although the digital asset market has traded lower this week, it is important to keep in mind that the profit-taking and capital flows remain low by historical standards. This suggests that the market may still have room for growth and expansion.
For instance, the average acquisition price of different cohorts in the Bitcoin economy is an essential indicator of price ranges. Realised price, a metric used to estimate cost basis, helps to determine the average cost of acquiring coins in a specific period. A chart comparing three cohorts - Young Supply Realised Price, Market Realised Price, and Old Supply Realised Price - reveals that spot prices have been rejected from levels coinciding with the Old Supply Realised Price.

Whales, individuals, or entities holding more than 1,000 BTC, have long been the subject of attention in the Bitcoin ecosystem, often being the focus of speculators. Interestingly, investor behaviour can be analysed based on wallet size cohorts, providing further insight into the market. The chart below outlines the average acquisition prices for whale cohorts, considering only coins moving in and out of exchanges. It traces the movement since the major market bottoms of different cycles, starting with the launch of Binance in July 2017, the 2018 bear market's cycle low in December 2018, and the bottom of the COVID sell-off in March 2020.
While all three whale sub-groups suffered unrealised losses as the market plunged below ~$18k in early November 2022, the recent recovery has been promising. The price of Bitcoin has stalled at the approximate cost basis of the Dec-2018+ era whales ($23.8k), coinciding with the Old Supply Realised Price. These insights paint an optimistic picture for Bitcoin, with whales and investors holding on to their coins even during market downturns, suggesting that Bitcoin's long-term outlook is bright. The data is promising for investors looking to buy, hold, and add to their cryptocurrency portfolios, as it indicates that Bitcoin has shown resilience even during challenging times.

A positive shift has also been observed in the Net Unrealised Profit/Loss (NUPL) metric since mid-January. NUPL looks at the difference between Unrealised Profit and Unrealised Loss to determine whether the network as a whole is currently in a state of profit or loss.
The weekly average of NUPL has moved from a state of net unrealised loss to a positive condition. The average Bitcoin holder is now holding a net unrealised profit of approximately 15% of the market cap. This pattern is similar to market structures observed in previous bear market transition phases, which indicates a potential shift in the market.
To account for lost coins, unrealised profits locked in the 7-year+-old portion of the supply can be subtracted to create an adjusted metric known as aNUPL. By this measure, the market is only slightly below break-even, and some might still consider it within bear market territory. However, the fact remains that NUPL has shifted positively.

Transfer volume is also an important indicator of market sentiment, with fluctuations often correlating with changes in the aggregate level of capital in the market. Monthly average transfer volume is a particularly useful metric, as it can help identify relative shifts in dominant sentiment and signal when tides are turning for network activity. The monthly transfer volume has increased by an impressive 79% to $9.5B per day since early January, pointing to a sustained period of growth and momentum. However, it is important to note that the yearly average transfer volume is heavily influenced by a large amount of FTX/Alameda-related wash volumes, so the current monthly transfer volume is still significantly below the yearly average.

To conclude, currently, the market is in a transitional phase, with the Realised Price of Older Supply and the average Whale that has been active since the 2018 cycle bottom serving as boundaries. Despite this period of change, there is cause for optimism as an initial wave of capital inflow into the space has been observed through profit-taking. While this capital wave is still in its early stages and historically light in total coin volume on the move, it signals a growing interest and belief in the potential of Bitcoin.