FAANG and 2023s Magnificent 7 – Peak Euphoria?
News
|
Posted 25/07/2023
|
3491
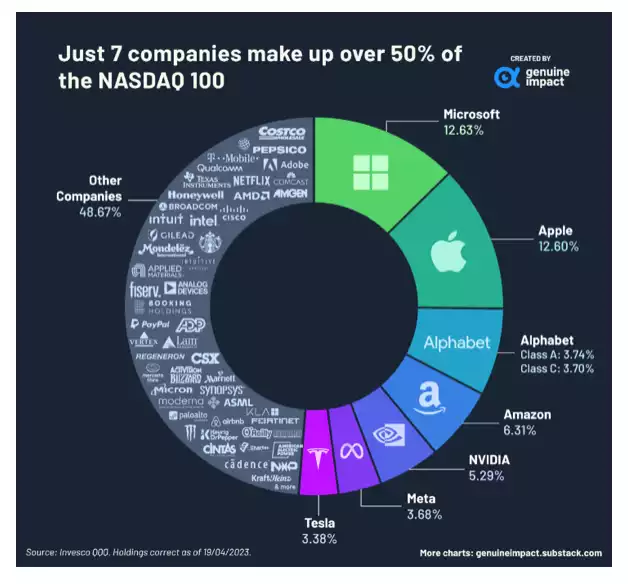
In 2013 Jim Cramer coined the name FAANG (Facebook, Amazon Apple, Netflix and Google), an acronym used to describe the most prominent Nasdaq tech companies. As names have changed along with market caps, there has been many iterations of their name. MANAMANA (Meta Amazon Netflix Alphabet Microsoft Apple Nvidia Adobe) FATANG (Meta, Amazon, Tesla, Apple, Netflix and Google). More recently and conveniently a nickname has taken hold ‘The Magnificent Seven’ named after a 1960s Western Film series, this list comprises of Apple, Microsoft, Nvidia, Amazon, Meta, Tesla and Alphabet. These 7 stocks have seen most of this year’s steep climb in the US Stockmarket and have individually climbed so much that for only the 3rd time in history, the Nasdaq 100 was rebalanced (reweighted) on US market open last night.
The Magnificent 7 in numbers
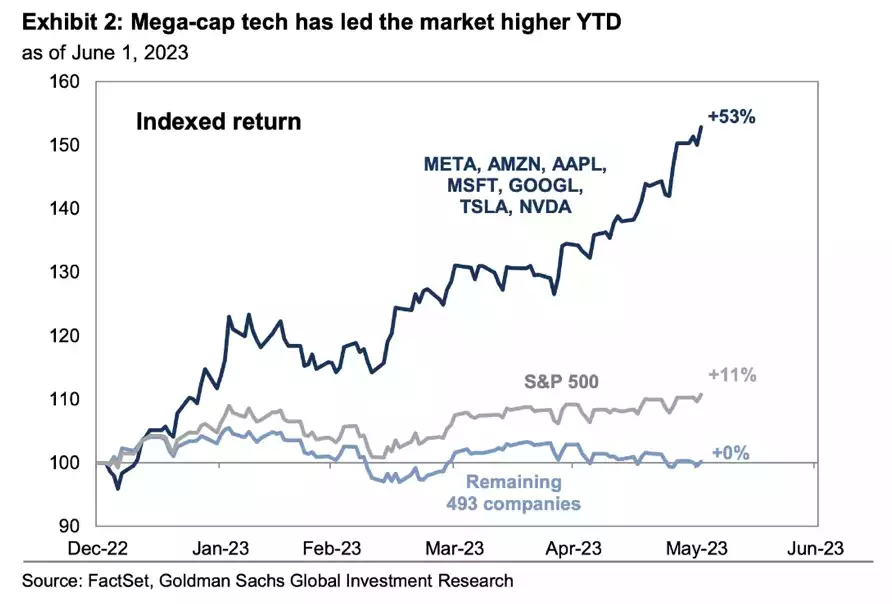
Since January this year these stocks have seen enormous returns Apple – 48%, Microsoft – 44%, Alphabet 36%, Amazon 54%, Nvidia 203%, Tesla 111% and Meta 144%. With these rises the Nasdaq 100 has seen a rise of 42% compared to the S&P at 19% and the Dow Industrials only 6.4%. In fact if you’d invested $10,000 in the Nasdaq 100 in 2013 you would have $50,000 compared to the S&P only $30,000
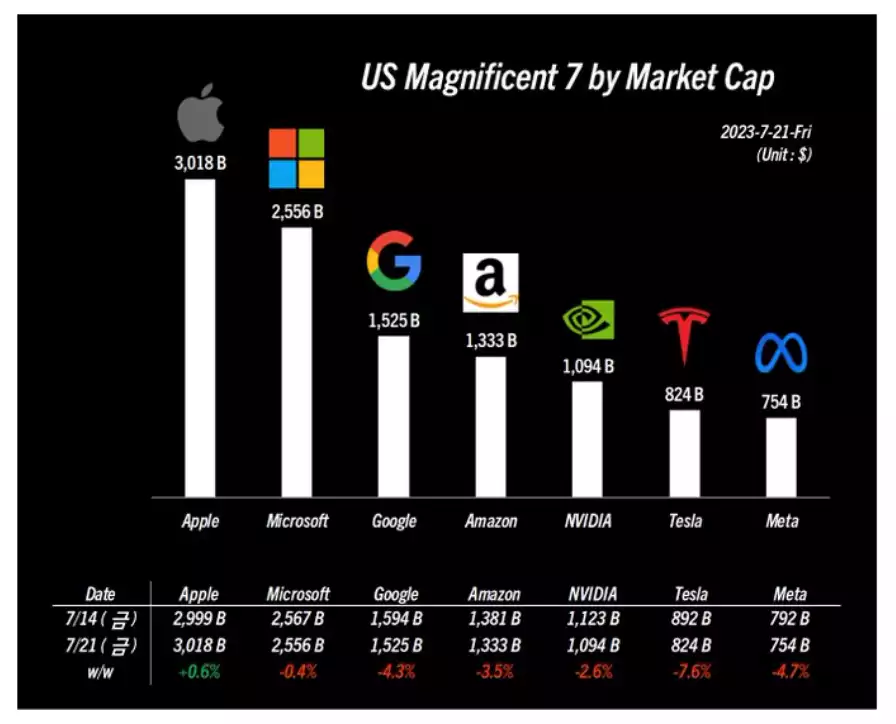
The current Price to Earnings ratio of the Magnificent 7 is 112, compared to an average of 15 to 18, this has led to staggering market capitalisations – with only Meta ($754 billion) and Tesla ($824billion) not in the trillion dollar club. In fact this year has seen Apple gain the $3 trillion mark. Some of these individual P/E ratios are even more jaw dropping, with Nvidia at 250 and Amazon at 312. Supporters argue the potential growth in these earnings support these valuations – but these companies are giants in their own industries which limit the potential upside without taking it from other industries or competitors. 312 years of earnings to get your money back on business as usual does seem a little expensive…
Nasdaq Rebalance
The Nasdaq 100 is a basket of the largest most actively traded Nasdaq companies, it has representation from several industries except for the financial industry. The technology sector is meant to represent 50% but since the Magnificent 7 bull run this year, this sector now sits at roughly 64%, the changes will see it move back to 50%.
Two other times in history the Nasdaq has been rebalanced, in December 1998 which Microsoft had climbed so much it made up 25% of the entire basket and in May 2011 saw Apple making up more than 20%. Both these rebalances were the rebalancing of 1 stock and saw very little impact on both the Nasdaq 100 and Microsoft (in 1998) and Apple (in 2011) share price.
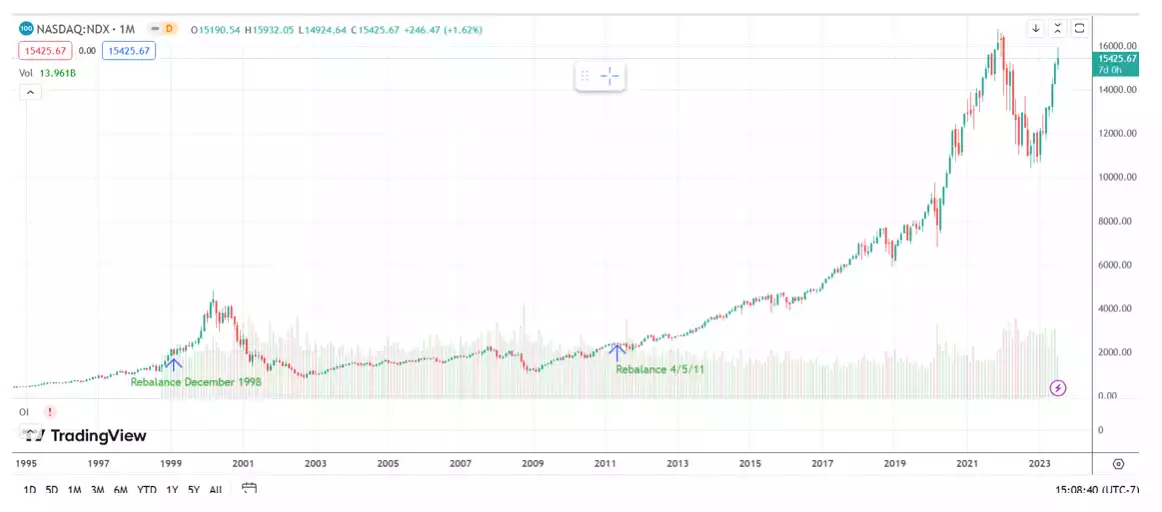
But this time it’s 7 stocks that are influencing the rebalance, so the movements and share prices are likely to be more volatile, especially as this rebalance has occurred right after the huge $2.3trillion option expiration, and also during a week when 50% of the market (by market capitalization) are reporting earnings.
The Case for a correction
As several funds track the weighting of the Nasdaq 100 the rebalance will see these funds buying and selling to align with the new changes. As passive dollars track indexes, the tracking becomes a multiplier when there’s a higher weighting. The most impacted companies are likely the ones with large changes including Nvidia reducing from 7.3% to 4.3% and Adobe increasing weight 1.5% to 1.9% for example.
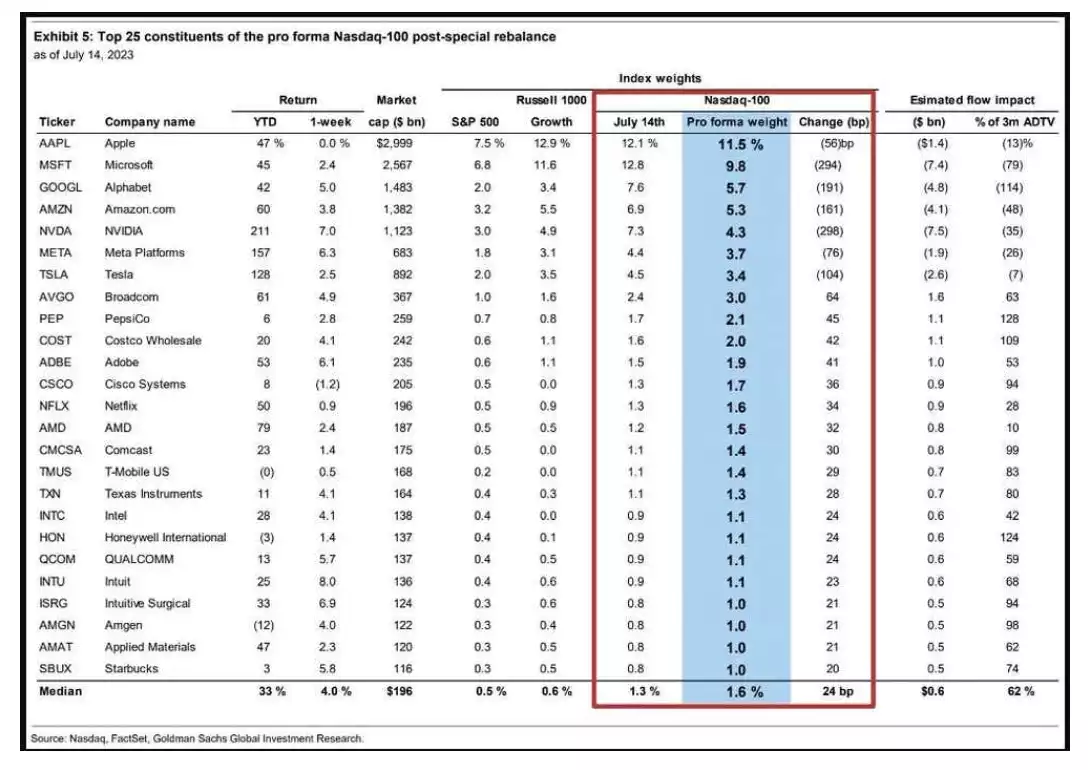
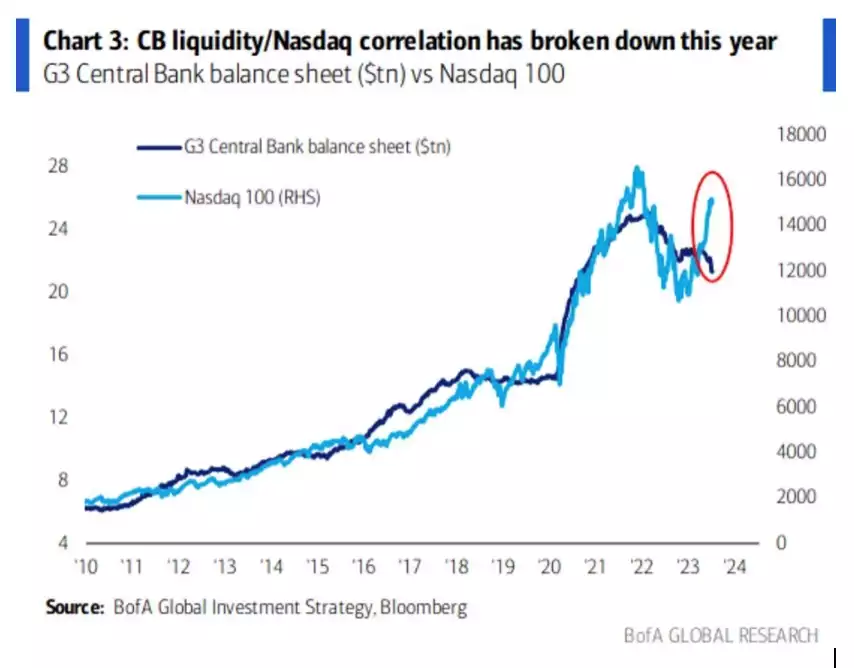
Many are using the rebalance as a possible turning point for the possible repricing of these assets. History has shown on the last 2 rebalances this was not the case, and in fact the market continued fairly bullishly following. But 1998 and 2011 were rebalanced because of 1 company, in 1998, Microsoft and in 2011, Apple. This time the rebalance has been triggered by 7 extremely large companies with historically high P/E ratios. The divergence of the growth of these stocks from the market can ben seen in the CB liquidity/Nasdaq graph, which for the 2nd time in history has gapped ahead of liquidity, screaming correction.
Another indicator that perhaps we are at a turning point was last week’s 2% drop, the biggest one day drop in the Nasdaq in the last 4 months on the back of disappointing results from Netflix and Tesla. Tesla shares plunged 9.7%, on the back of profit margins slipping and Netflix lost 8.4% having missed sales estimate. Investors, having ridden the Nasdaq 100 supersized ride are beginning to get nervous.
This week we see this reporting continue from a large part of these stocks and if these tech earnings miss, the Euphoria which has driven these highs may quickly be extinguished for a wild ride.
Bringing it back to gold
The bull run in US equities may continue for a while longer but there’s no denying, we are seeing extremely lofty valuations within the Nasdaq 100 which has been the primary reason for the current share market rally. Cracks in the Magnificent 7 are beginning to show, with earnings not keeping up with the pace needed to maintain these valuations and a continued redundancy drive within these companies. If these stocks begin to drop there could be a possible downward correction in the USD as investors may move their money out of the US in search for higher yields, this in turn would drop the need for USD at a time when the DXY looks dangerously close to a continuation of its downward trajectory, 2 weeks ago dropping to 100 and currently sitting at 101.38 as of this morning. That rising USD we’ve seen for the last few years has been supported by buyers of USD to buy these surging shares as the Fed flooded the market with liquidity.
And nothing helps gold and silver like a weak USD so keep watching the markets, cause you won’t want to miss this change.