Expect Volatility
News
|
Posted 25/10/2022
|
10582
Last week we discussed digital assets' remarkable stability despite all surrounding market volatility increases. The trend hasn't changed, with crypto market volatility levels compressing to historical levels.
BTC has been trading within an incredibly small US$869 range. Just 4.6% separates the weekly low of US$18,793 from the high of $19,662. As we have mentioned, these periods of extremely low volatility for Bitcoin are very rare, and there are historical examples that have broken both higher, and lower, with extreme force.
Firstly, lets look at a price chart with Bollinger Bands – the easiest way of demonstrating how compressed the market is. We are VERY likely to see a Bollinger Band Squeeze any moment….
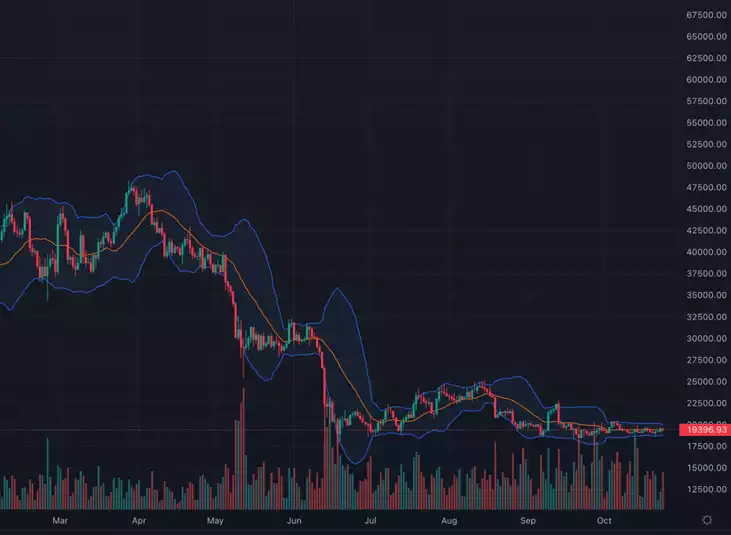
So the question is, will the breakout move favour the bulls or the bears? Let's look at both cases from an on-chain perspective.
The chart below assesses the momentum of new on-chain addresses, comparing the short-term vs the long-term moving average. As can be seen in Nov 2018, a failure of the monthly average to attain positive momentum was a precursor to a sell-off from $6k to $3.2k. On the other hand, Jan 2019 represented a burst of new activity which propelled markets from $4k to $14k.
New Address Momentum is on the cusp of yet another push higher but is yet to show a convincing 2019 burst of strength. With a slight reduction in recent weeks, this suggests a lacklustre inflow of new demand at present due to the central banks globally removing liquidity from the market at a record pace. While BTC has remained solid during the last few months of hikes, it's unlikely that we see momentum (in terms of new addresses) until central banks pivot.

The growth rate of addresses with a non-zero balance has also stagnated since August, which is also similar to the November 2018 period. This indicates that despite there being some 400k New Addresses per day, there are as many which are being emptied of their entire balance.

Of most concern is the BTC mining industry, which has been on notice lately with the hash rate and difficulty pushing to new all-time highs. This has increased the cost of BTC production, despite miner revenues per hash falling to all-time lows. Increasing costs and decreasing revenue is, well, not good… The risk associated with this scenario is that miners liquidate all of their BTC treasuries, dumping them into the market and packing up shop.
We have seen a similar scenario in the past. A bearish cross-over was last seen in mid-2018, with a major mining industry capitulation following soon after, and persisting for several months.

It’s not all doom and gloom for crypto though. Holders remain steadfast in their unwavering conviction to hold on for dear life. Using on-net flows through exchanges we can then assess whether there is any loss of conviction amongst existing longer-term holders.
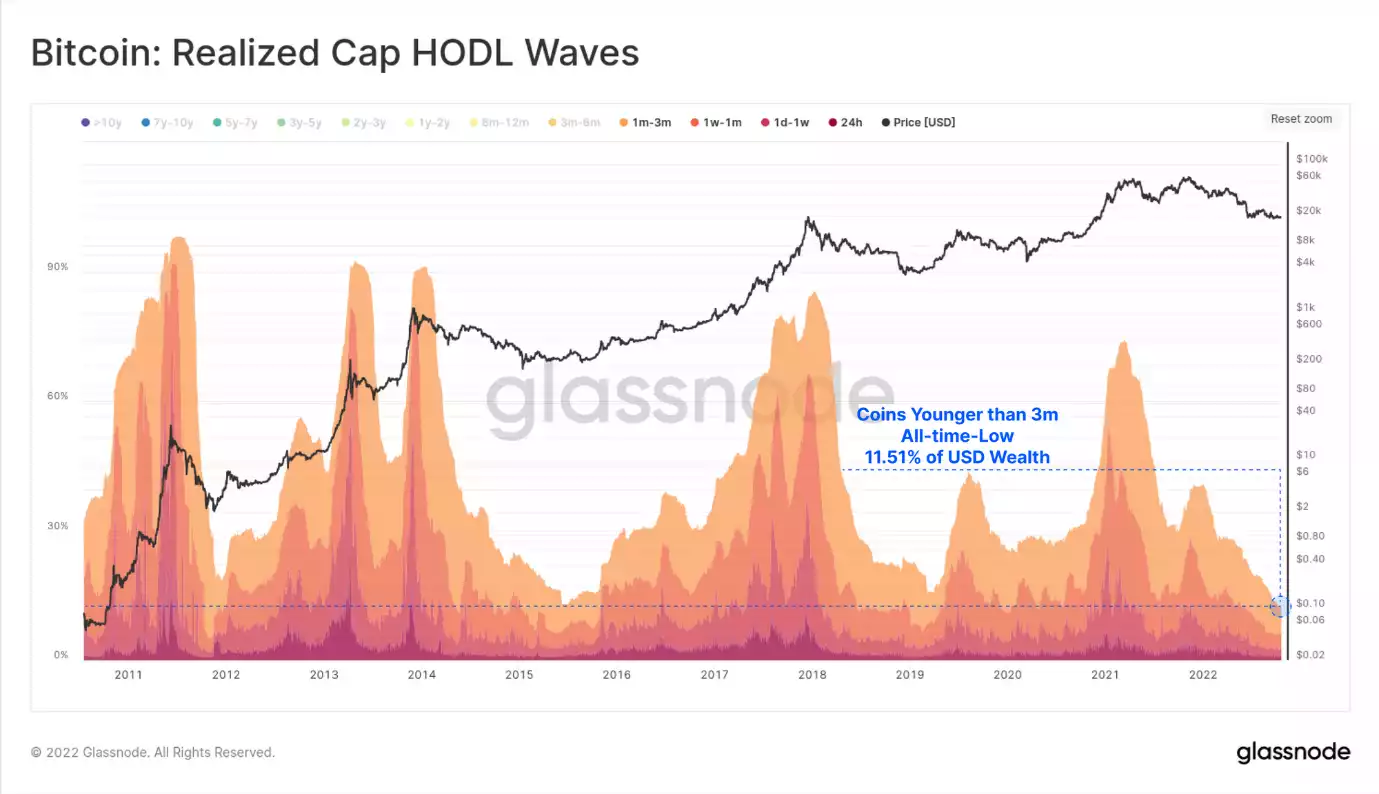
The total USD wealth held in BTC, valued at the time of each coin's last transaction, is now disproportionately skewed to longer-term holders. The proportion of wealth held in coins that moved in the last 3-months is now at an all-time low. The reciprocal observation is that wealth held by coins older than 3 months (increasingly held by HODLers) is now at an all-time high.
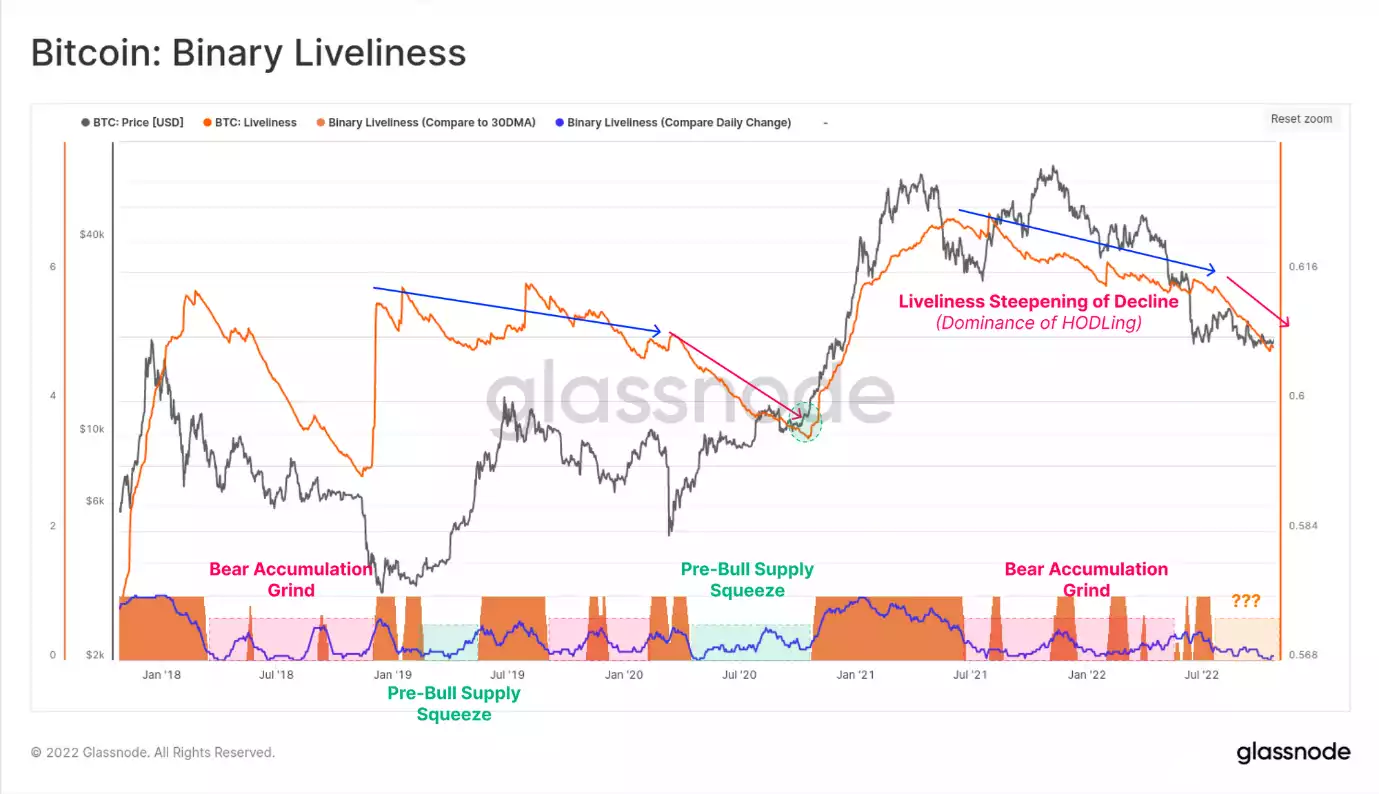
This is further validated by the Binary Liveliness metric, where we can draw two key observations:
- The steepness of the Liveliness decline is accelerating, indicating the market is very heavily aligned with HODLing style behaviour. Old hands are simply not spending.
- The Binary Liveliness oscillator, which compares recent steepness vs a rolling 30-day baseline, is at extreme lows. Such events correspond with extreme HODLing behaviour, usually seen during early-mid stage bear market accumulation (the grind), and immediately before bullish reversals (a supply squeeze).
To put it simply, EXPECT VOLATILITY. We're yet to know whether the bulls or bears will come out on top but time will tell.
The Bear Case is one of a historically low on-chain utilisation profile, and a looming miner deleveraging event. With a $1.5B miner overhang, being just one source of distressed BTC, and multi-year lows in both trading and transfer volumes, significant distribution may meet thin order books.
The Bull Case takes a view on the HODLers of last resort, whereby the supply flows out of exchanges, and into HODLer wallets is at an all-time high. Despite being small in relative number, the conviction of Bitcoins die-hard believers is unshaken, and their balance continues to grow, through thick and thin.
Place your bets, are you team bull or team bear? Let us know in our Gold Silver Standard Group – discord.gg/gold