End of an Extended Bear Market: The Latest Bitcoin Market Analysis
News
|
Posted 07/02/2023
|
11865
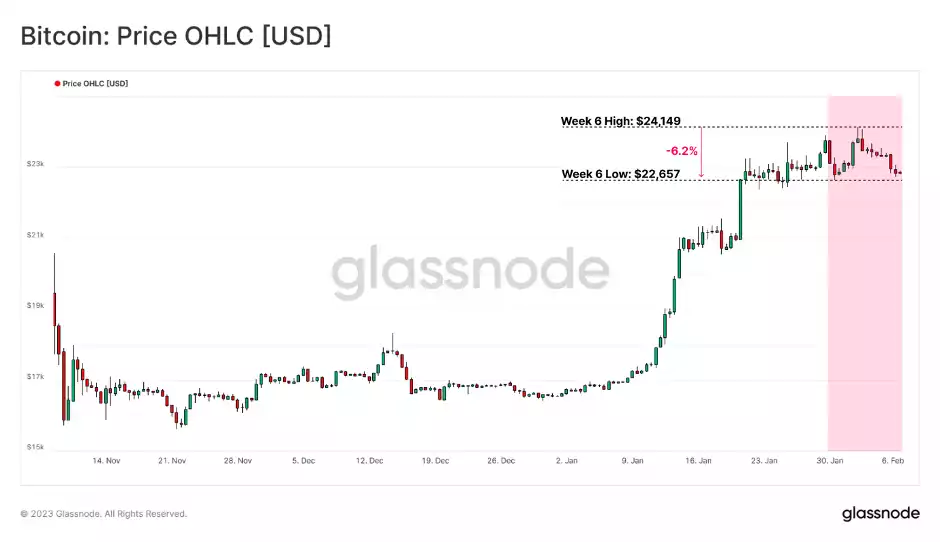
The price of Bitcoin has been experiencing volatility as it consolidates above the cost basis of multiple groups. The average Bitcoin holder is currently sitting on an unrealised profit. However, recent on-chain indicators suggest that the market may be turning tides. Despite a recent -6.2% pullback to a weekly low of US$22.6k, it remains to be seen what the future holds for cryptocurrency.
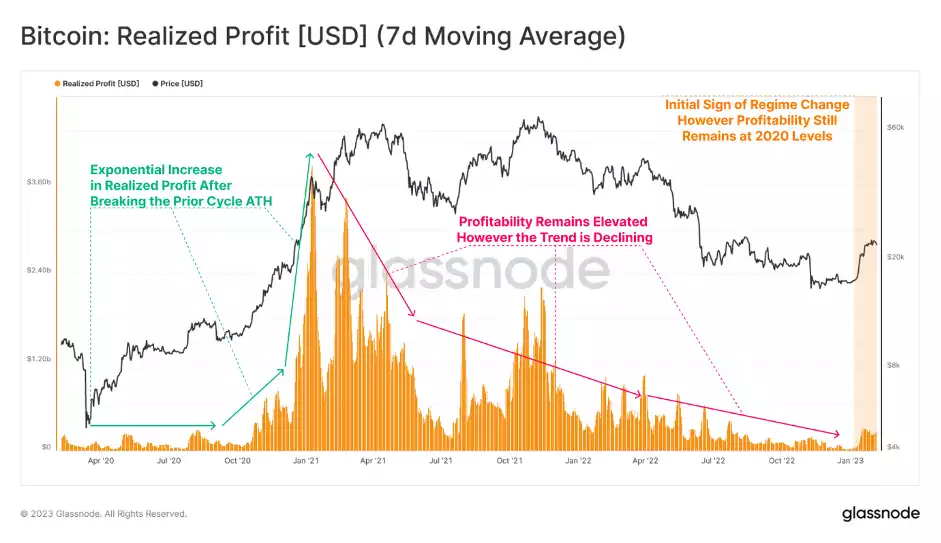
A return to profitability has been observed in the market. In October 2020, there was an explosion of profit-taking due to monetary policy. However, after the January 2021 peak, profits diminished and returned to 2020 levels. Although there has been a recent resurgence in realised profits due to recent price action, it has been muted compared to the exuberance seen in the 2021-2022 cycle.
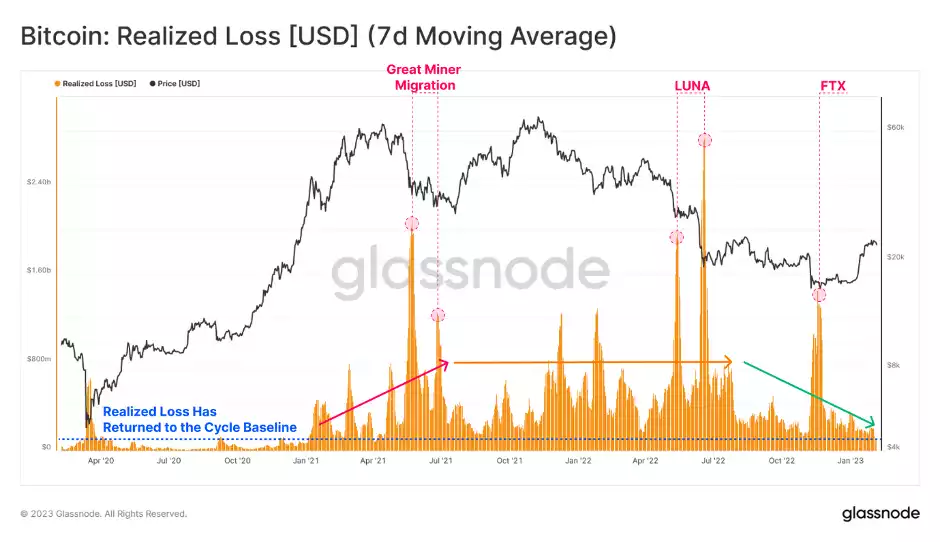
The market's decline in realised losses, which have decreased towards the cycle baseline of around $200 million per day. A contraction in the loss profile has also been observed. This trend is expected to continue, barring any explicit capitulation events such as those seen in LUNA or FTX.
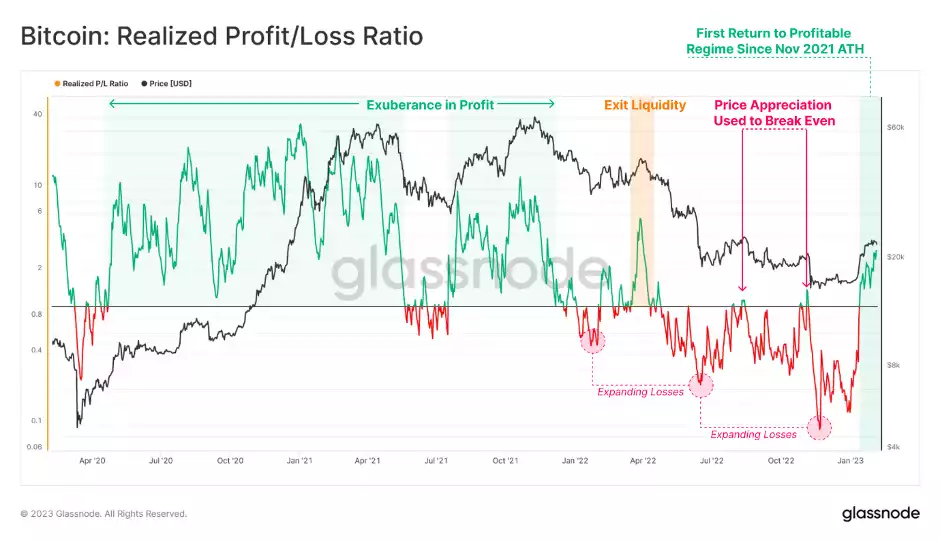
The ratio between realised profits and losses plays a crucial role in identifying changes in market dominance. After the November 2021 all-time high, the market was dominated by losses, and the realised profit-to-loss ratio was below 1 with increasing severity. However, there has been a recent sustained period of profitability since April 2022, which is the first of its kind since the exit liquidity event. This suggests that there may be initial signs of a change in the profitability regime in the market.
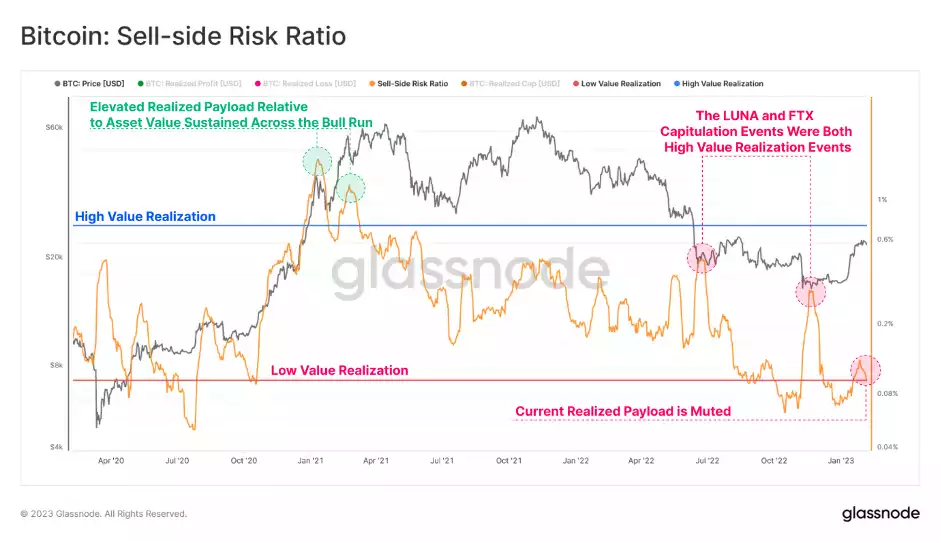
The Bitcoin Sell-Side Risk Ratio provides an important metric by comparing the magnitude of realised profit and loss as a percentage of the realised capitalisation of the network. Despite the combined volume of realised profit and loss, it remains small compared to the overall asset size. This indicates that the magnitude of spending events is still marginal, especially when compared to the bull market or the FTX capitulation event. The data suggests that most of the coins currently in circulation were acquired close to the current spot price and have not yet locked in large "realised" gains.
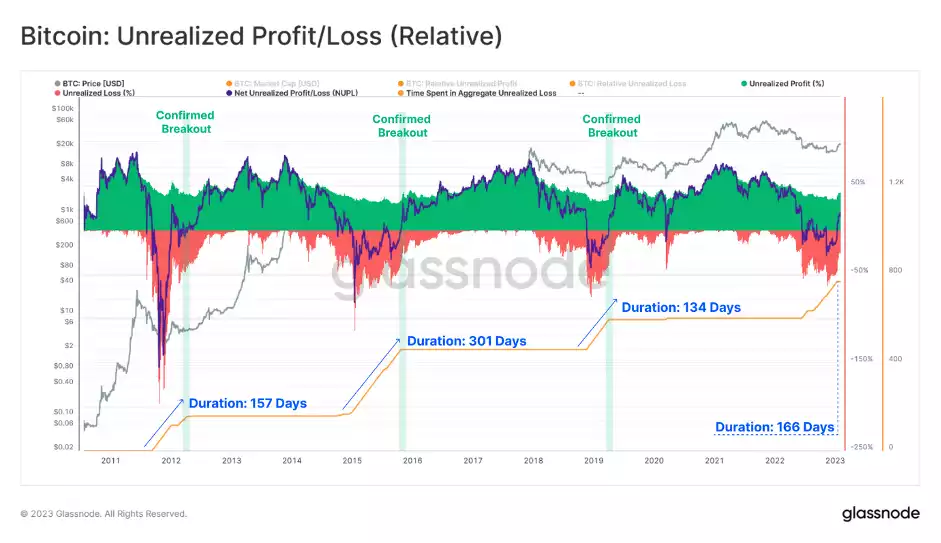
The Net Unrealised Profit/Loss Ratio (NUPL) provides a measure of market sentiment and indicates the recent rally has put the market in a regime of unrealised profit. This means that the average holder is now back in the green. The duration of negative NUPL has been similar to that seen during the 2011-2012 and 2018-2019 bear markets, lasting for approximately 166 days. However, the longest bear market to date was in 2015-2016, with a realised loss regime that was nearly twice as long as the runner-up, the 2022-2023 cycle.
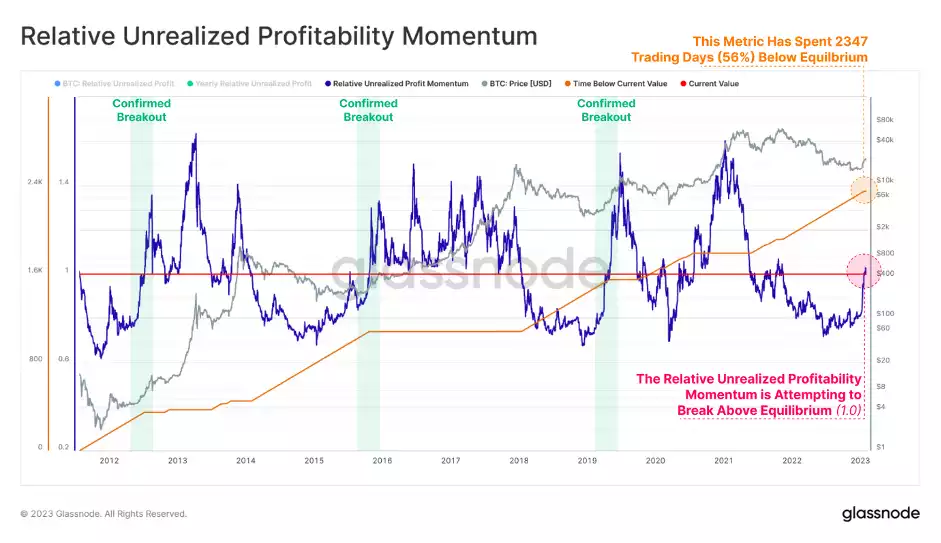
The ratio of total unrealised profit to the yearly average provides a macro-scale indicator for the recovering market. The recent surge in the price above several aggregate on-chain cost-basis models has improved the market's financial position. A momentum metric that is approaching an equilibrium breakpoint has been observed, similar to the recoveries seen in the 2015 and 2018 bear markets. Breakouts above this equilibrium point historically coincide with a transition in the macro market structure. The length of time elapsed below the equilibrium point has been similar across major bear markets, further emphasising its significance in market analysis.
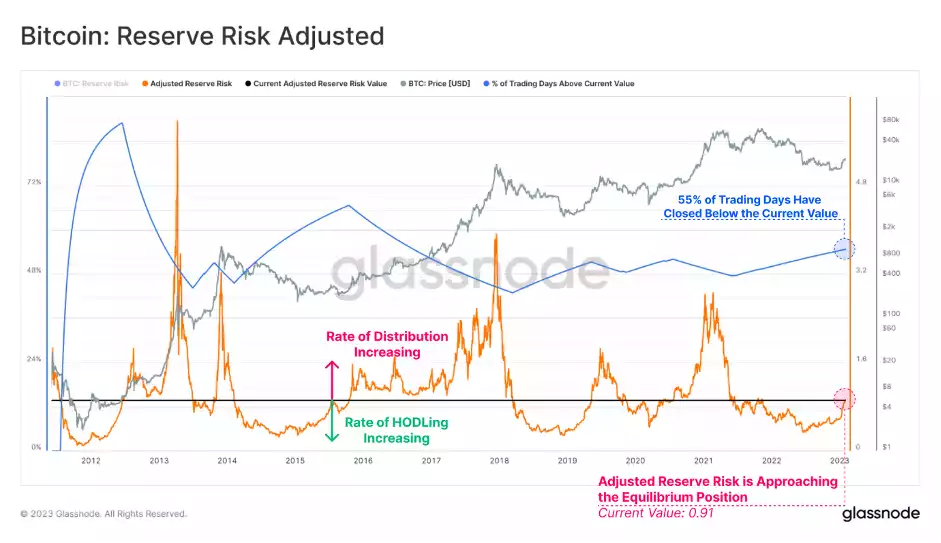
The Adjusted Reserve Risk metric measures the balance between the aggregate incentive to sell and the actual expenditure of long-dormant coins. Higher values indicate an elevated price and HODLer spending, while lower values indicate a declining price and HODLer spending. A structural change in the trend is underway, with the oscillator approaching its equilibrium position. This indicates that the opportunity cost of HODLing is decreasing and the incentive to sell is increasing, as the oscillator has been below its equilibrium position for 55% of all trading days. Previous breakouts above the equilibrium position have marked a transition from a HODLing regime to increased profit realisation and the rotation of capital from older bear market accumulators to newer investors and speculators.
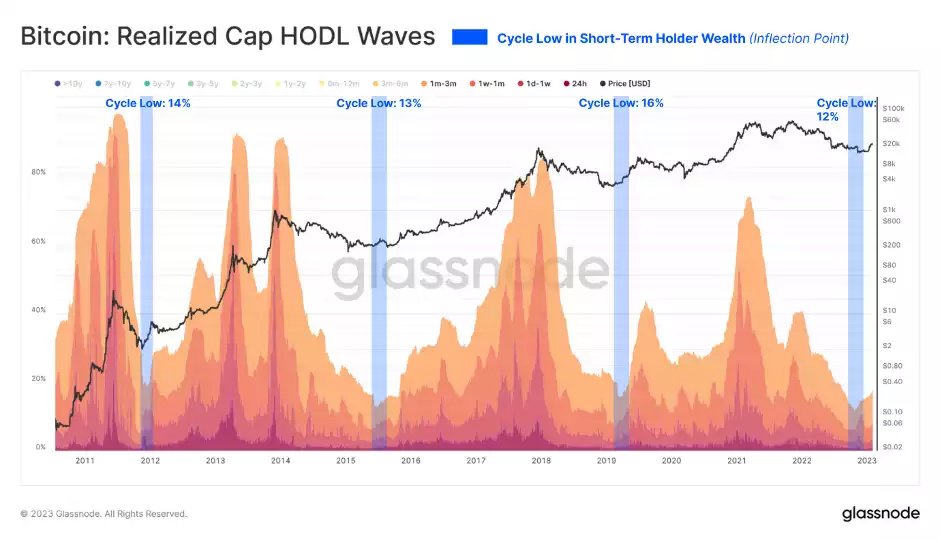
The Realised Cap HODL Waves metric is used to analyse the behaviour of the HODLer class. According to the metric, the percentage of wealth held by newer holders is increasing, which suggests that wealth is transferring from older hands to newer ones. This change in wealth distribution is consistent with historical precedents, indicating that the current market trend is following a familiar pattern.
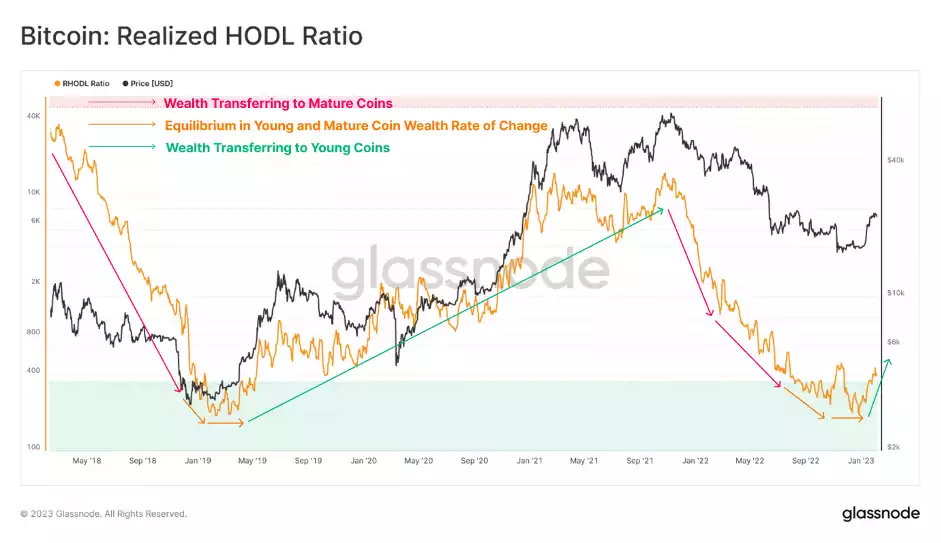
The Realised HODL Ratio compares the balance of wealth held between 1-week and 1y-2y old coins. A higher value of the ratio indicates a disproportionate amount of wealth held by new buyers and speculators, while a lower value indicates a disproportionate amount of wealth held by long-term HODLers. The rate of change and trend direction of the ratio is considered more important than its absolute value. Currently, the formation of a rounding bottom structure is observed, suggesting a transfer of wealth and a trend transition to the upside. This could indicate that the market is undergoing a shift towards a new period of growth and increased investment activity.
According to the latest market analysis, the end of an extended bear market may be in sight, as there are signs of a cyclical transition underway. This transition is marked by a shift in the balance of aggregate profit and loss, with capital moving from Long-Term Holders to Short-Term Holders over the past 12 months, as reflected in the growing wealth held by the Short-Term Holder cohort.
As the market appears to be in a transitional phase, evolving from the late stages of a bear market to the beginning of a new cycle, it is important to note that historical examples of such periods have shown it to be a difficult and volatile time. Despite these challenges, the trend towards a new cycle is an encouraging sign for market participants.