Digital Assets Weathering The Storm
News
|
Posted 11/10/2022
|
10892
Bitcoin markets traded slightly higher this week, rallying from a low of US$19,037 to a high of $20,406. Prices remain rangebound, consolidating for over 120 days since the major deleveraging event in mid-June.
To summarise the state of the crypto market – investors are attempting to establish a bear market floor. This is evident by similarities in previous bear market on-chain dynamics and now. Using this data we can compare the market structure to past cycle lows. Let's have a closer look…
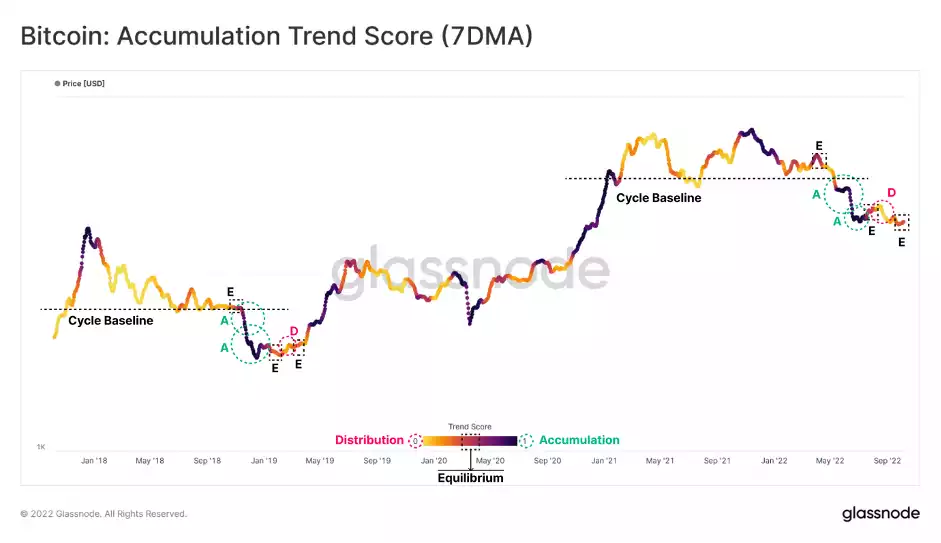
The Accumulation Trend Score reflects the aggregated balance change intensity of active investors over the past 30 days, where a higher weight is assigned to larger entities. Approaching a value of 1 indicates that, on aggregate, larger entities are adding meaningful volumes to their onchain balance. Approaching a value of 0 indicates that, on aggregate, larger entities are distributing meaningful volumes, exiting the market.
Remarkably, after breaking the current cycle baseline at $30K, a series of consecutive events like the 2018-2019 bear market has taken place. Throughout the capitulation in early 2022, the Accumulation Trend Score indicates that significant accumulation by large entities has taken place, even throughout the recent bear market rally to $24.5k where many looked for exit liquidity. At present, this metric suggests an equilibrium, or neutral, structure in the market, which is curiously similar to early 2019.
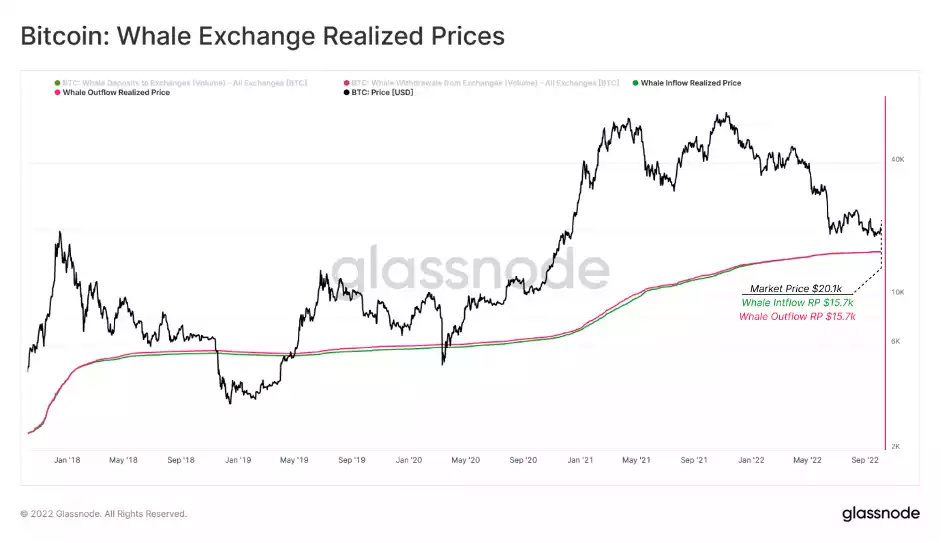
Looking further into large on-chain entities, we can calculate the cost basis for all whales who have been actively speculating over a chosen period. This calculation can deliver a threshold level that is psychologically important to these large investors. By price stamping the deposits and withdrawal volumes of the whale cohort (1k+ BTC) to and from exchanges, the calculation estimates the average price of Whale Deposits/Withdrawals since Jan-2017. This Whale cost basis is currently around $15.8k.
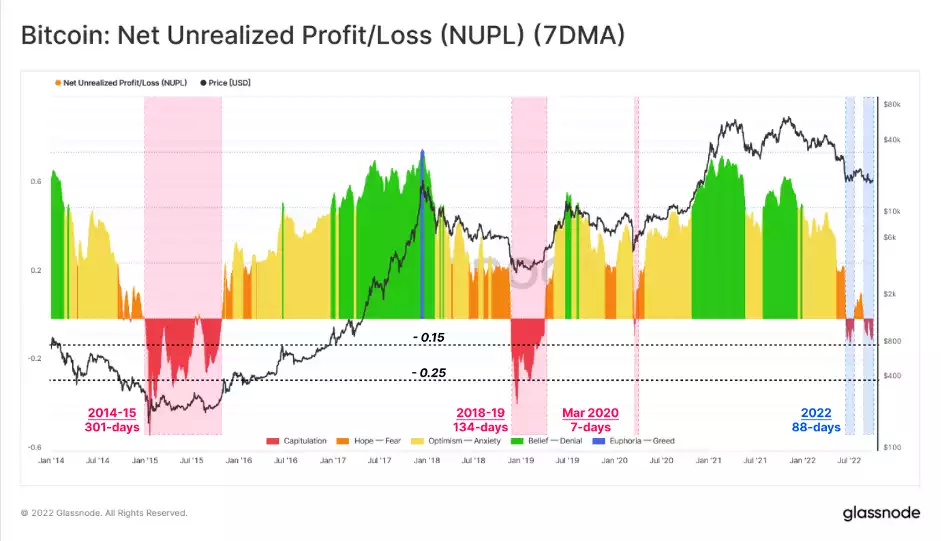
Another metric, Net Unrealized Profit/Loss (NUPL), maps out the difference between unrealised profit and loss of the network as a proportion of the market cap. NUPL considers both the loss and profit held in the supply through various phases of a market cycle.
Since early June, NUPL has dropped into a compressed negative range of 0% to -15% on two separate events, lasting a total of 88 days so far. From a comparative perspective, NUPL has traded down to levels lower than -25% in prior cycles and remained negative for between 134-days (2018-19) and 301-days (2014-15). This is an extremely constructive indication that we may be closer to the end of the bear market than the start.
Bitcoin prices have shown remarkable relative strength of late, amidst a highly volatile traditional market backdrop. Several macro metrics indicate that Bitcoin investors are establishing what could be a bear market floor, with numerous similarities to previous cycle lows.
Network profitability has not quite hit the same level of severe financial pain as in past cycles, however, adjustment for lost and long HODLed coins can explain a reasonable portion of this divergence.
In many ways, many on-chain metrics, market structures, and investor behaviour patterns are dotting the i's, and crossing the t's for a textbook bear market floor.