Digital Asset Markets Rally: Understanding the Impact on Investor Behaviour and Profitability
News
|
Posted 24/01/2023
|
9401
Exploring the Impact of the Recent Bitcoin Market Rally on Investor and Miner Behaviour
In a recent market rally, the price of Bitcoin (BTC) has risen above US$23,000, surprising investors and leading to increased motivation for holders and miners to take exit liquidity.
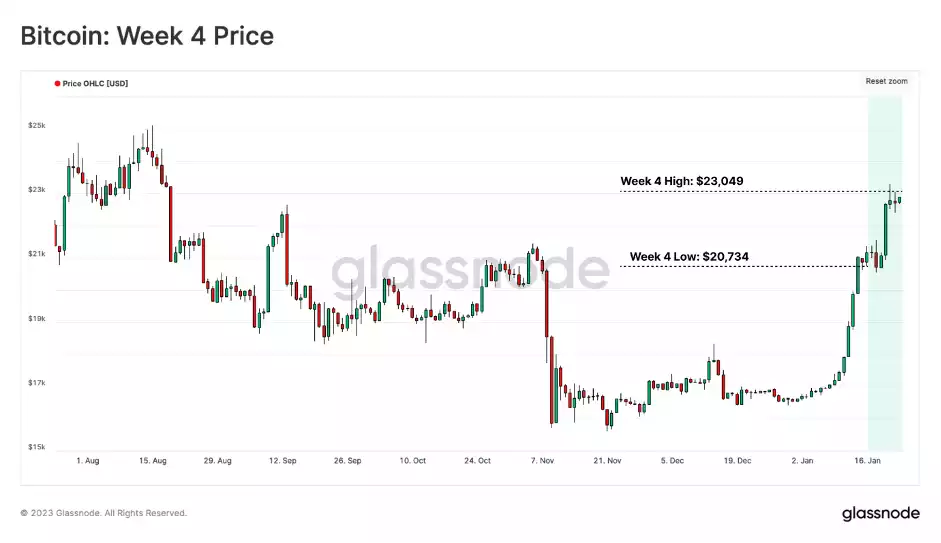
As prices continue to rise, shifts in behaviour are being observed among short-term holders, long-term holders, and miners. New investors and miners are motivated to spend and exit the market, while long-term holders are showing more resilience, with coins crossing the 6-month age threshold and reaching new highs.
The recent rally has also had an impact on the profitability of market participants, affecting their behaviour patterns.
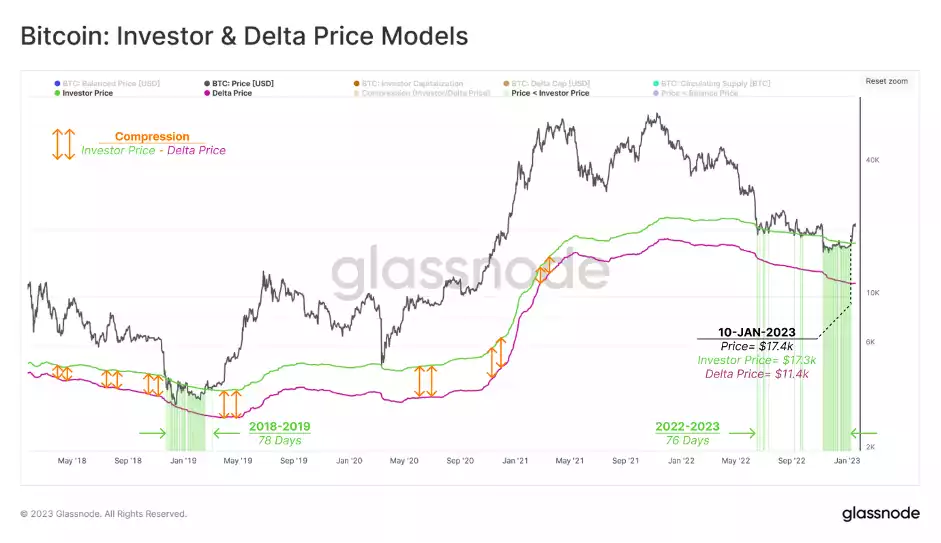
The recent surge in price action for Bitcoin, reaching the $21k to $23k region, has involved reclaiming multiple on-chain pricing models. This is historically significant as it signifies a psychological shift in holder behaviour patterns. Additionally, the price action across 2018-2019 and the current bear market bottom discovery phase has spent a similar amount of time within the Investor-Delta price band. This suggests that there is an equivalency in the duration of pain across the darkest phase of both bear markets.
Tracking Market Recovery with the "Percent Supply in Profit"
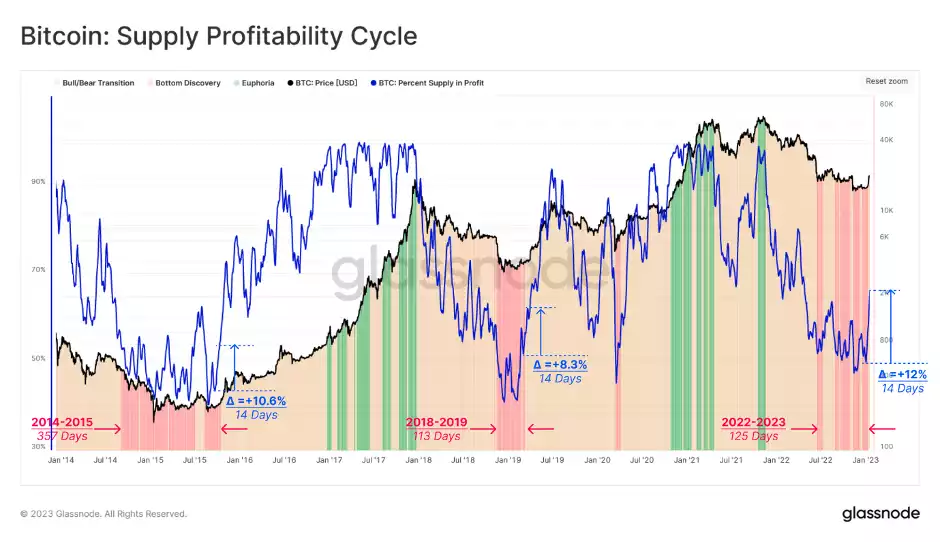
It appears that the market may be recovering and transitioning out of the bottom discovery phase. One way to track this is by monitoring the "Percent Supply in Profit" metric. A healthy equilibrium between profit and loss is when the weekly average falls between 55% and 80%. This metric can provide valuable insights into when a market recovery may be underway.
With prices increasing from $16.9k to $23.1k, this rally coincides with an abrupt surge in the "Percent Supply in Profit" from 55% to over 67%. This represents one of the sharpest spikes in profitability compared to prior bear markets. This could be an indication that there has been a significant volume of coins transacted and changed hands below $23.3k.
Analysing and Comparing Performance during Bear and Profit-Dominant Cycles
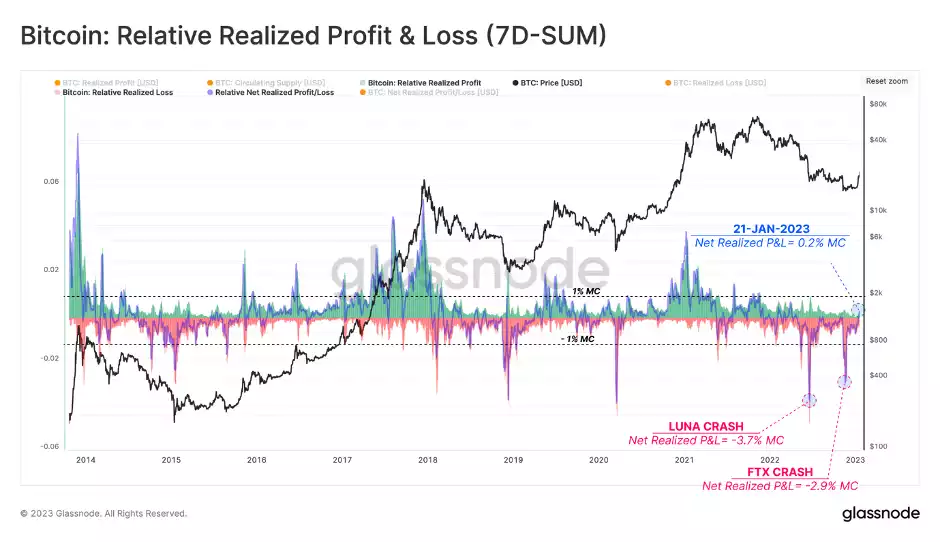
An abrupt change in the unrealised profitability of a cryptocurrency can motivate investors to react. One way to measure the profitability of cryptocurrency investment is through Realised Profit and Loss (RPL) metrics. These metrics calculate the difference between the value of coins at the time of disposal and the time of acquisition on the blockchain. A useful tool for analysing RPL is a chart that displays the weekly aggregated volume of RPL alongside the Net Realised Profit and Loss. This chart is normalised by Market Cap, which allows for comparison across different market cycles.
The current bear market, which started in November 2021, has undergone two large capitulation events, resulting in a net loss of -2.9% and -3.7% of market cap per week. However, the market has recently shifted towards a state of Profit-Dominance, which is a promising sign of healing after the heavy deleveraging pressures experienced in H2 2022. This indicates that investors are starting to see positive returns on their investments and that the market is recovering from the recent downturn.
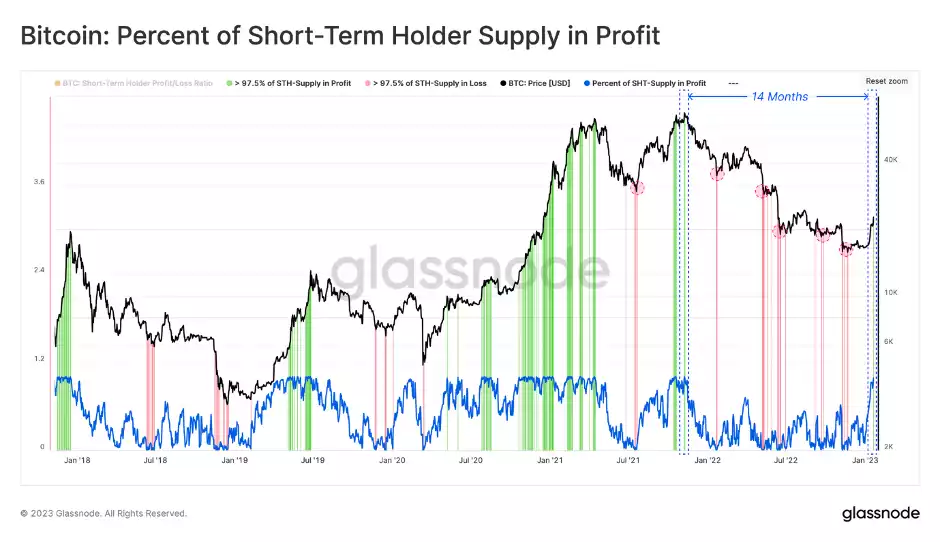
Assessing Short-Term Profit Supply
The current market presents an opportunity for new investors as the prolonged bottom discovery stage allows for new investor behaviour to be influential in forming local recovery pivot points. One metric that can be used to assess new investor behaviour is the percentage of short-term holder supply in profit. In bear markets, if the acquired supply by new investors is >97.5% in loss, it leads to a high chance of seller exhaustion. However, if the acquired supply is >97.5% in profit, it leads to an opportunity for these investors to seize and exit at break-even or profit. When the market saw a surge to $23K, this metric was pushed to >97.5% in profit for the first time since the all-time high in November 2021. This is likely to lead to increased sell pressure from short-term holders.
Uncovering Market Insights with the Long-term holder - Market Value to Realised Value (LTH-MVRV) Ratio
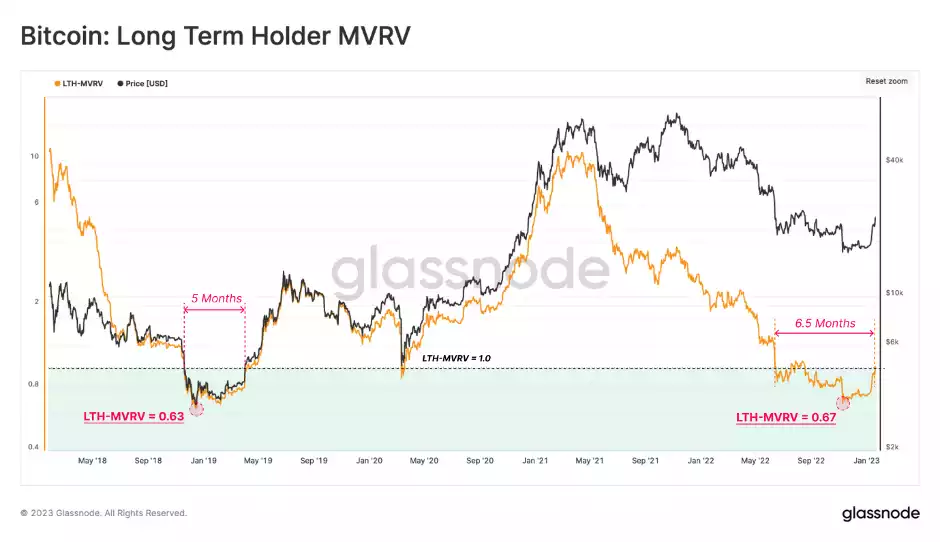
The market is a complex system and understanding it requires a holistic approach. While the profitability and behaviour of short-term holders can provide valuable insights, it alone does not provide a full understanding of the market. To gain insight into unrealised profit or loss, we use the Long-term holder - Market Value to Realised Value (LTH-MVRV) ratio, which compares the cost-basis of the long-term holder cohort against spot prices.
After 6.5 months, the market price has finally recovered above the long-term holders' cost basis at $22.6k, indicating that the average LTH is only slightly above break-even. When comparing the time length and the lowest printed value, the ongoing bear market is similar to 2018-2019 so far.
What next? Tracking Long-Term Holders' Spending
The recent price recovery has improved investor profitability, as price models show that the recent rally has reclaimed several cost-basis models and made supply held at a profit more favourable. Higher prices and the potential for profits may motivate supply to re-enter liquid circulation. Analysis of cohort behaviour shows that short-term holders and miners have been motivated to liquidate a portion of their holdings. However, long-term holders' supply continues to grow, indicating strength and conviction among this cohort.
Watching long-term holders' spending is likely a key tool to track in the coming weeks as it will give us an insight into their sentiment and belief in the market's future. Let’s see what the rest of the week brings.